
18 Data
Karna Younger and Carmen Orth-Alfie
Learning Objectives
After reading this chapter, you will be able to:
- Define data, differentiating it from information.
- Identify open, privileged, and closed sources for data.
- Recognize and consider ethical implications of using data, such as privacy and other concerns.
Using Data to Tell a Story
Over the last decade, there have been more than 52,000 unsolved homicides across 50 major U.S. cities. Even more disturbing, there are distinct patterns to where murders occur and arrests are or are not made, according to The Washington Post. Surviving family members feel their loved ones have been forgotten by apathetic police. Police feel disconnected from members of low-income communities who are too frightened to speak out against violent gang members.
In its feature article on these murders, the Post brought to life multiple tragedies from Boston to Kansas City to Los Angeles, using the words of law enforcement officials, surviving family members, and community members. These witnesses attested to the multiple factors that prevent community members from speaking out against crime and police from capturing the culprits. Their tales twist throughout the article and evoke teary eyes in an embedded video.
These heart-wrenching stories, however, do not prove that these unsolved homicide matter. They do not confirm The Post’s credibility.
The numbers do.
The newspaper’s transparent use of data was the key to connecting the dots between all of these deaths, and establishing article’s credibility. The Post made its data public and detailed the methods its data reporters followed to collect, clean and crunch the data into interactive maps that illustrated the story’s argument.
Reporters collected data from police departments and filled in the departments’ gaps with public records, including death certificates, court records and medical examiner reports. As a result, the Post’s homicide report “is more precise than the national homicide data published annually by the FBI,” the newspaper explained. The Post faulted federal data for failing “to distinguish whether a case was closed due to an arrest or other circumstances, such as the death of the suspect, and does not have enough detail to allow for the mapping of unsolved homicides.”
What the Post accomplished is impressive and time consuming. Data journalism is a “frustrating” process, said Sarah Cohen, a New York Times data journalist who won the Pulitzer Prize for her investigative work with the Post. Transcribing data from paper and digital formats and making certain that it is “clean,” or machine readable for a program such as Excel, takes about 90 percent of a journalist’s time on time-consuming projects, Cohen said.
Data are vital to the storytelling of journalists and strategic communicators. As seen in the Post’s article, journalists’ use of data allows readers to understand the bigger picture. By crunching the numbers and creating easy-to-use maps of homicide and arrest rates, the Post helped its readers see and understand that this is not just a matter of a few unsolved murders, but more of a national crisis. In other words, data enabled the Post to create convincing visuals and tell more stories of victims, survivors, and police in a way that would not have been otherwise possible.
Like journalists, strategic communicators need to use data to convey to key stakeholders the needs and achievements of their clients. For instance, strategic communications teams for The New York Times Company and other public businesses detail and synthesize data in annual reports to sell their companies as successful investment opportunities. Other communications professionals use data to conduct audience analyses, or to develop a company’s digital strategy to better market a product.
Don’t worry. By the end of this chapter, you will not be expected to launch a national investigation about how the FBI tallies homicides, or to decide why “Deadpool” fans would love to rock Crocs shoes. Instead, in this chapter, we will define data, identify some places to access it, and briefly discuss some guidelines for using it in your own work. This will better prepare you to enter a world that is increasingly producing and consuming data.
Defining Data
Our worlds are saturated in data and have been for some time, even if we do not even know it. Anytime you use a computer, buy something at a store or online, listen to music, or just live your life, you are encountering and creating data. But what exactly is data?
Data are “little points of information that are often not relevant in a single instance, but massively important when viewed from the right angle,” according to journalist Mirko Lorenz in the “Data Journalism Handbook.” In other words, data enable communicators to piece together numbers, pictures, words, and other forms of facts into big, meaningful pictures for readers.
More precisely, data are “statistics and facts collected for analysis,” according to Rob Stokes, an e-marketing executive and textbook author. A trick to recognizing data when you see it is to remember that data do not make any sense when you just look at them. This is because data lack context. Data with context are information.
For example, if you saw a list of words on it including the word “river,” you wouldn’t really know what it was about, because you do not have the context, or greater understanding of what binds all that data together. But if you listened to Leon Bridges’s “River,” the greater context of hearing Bridges sing that spreadsheet would help you understand the data to be lyrics, or information.
Even if you don’t use it in your own work now, data will be important to your future self. Newsrooms in New York and elsewhere are increasingly data-driven. Data is being implemented in reporting to make reporting more transparent and credible to readers. In the business of the news, data can be used to boost revenue by implementing such programs as personalizing editorial content.
And don’t think you will escape data in marketing. Data is part of marketing’s future, too. So be kind to your future self, and spend some time now learning about how to access and use data.
Data Access Categories
When you are looking for data, it is helpful to think to yourself, “Who would create or collect this data? Who is willing to pay for the data to be collected? Why did they do this? How can I get access? Is the data open or closed?”
To help you answer these questions, we will define and walk you through categories of data, based on your ability to access and use data: open, privileged, and closed. There are many, many different types of data, and not everyone will define and categorize data the way we do here. We will move through and provide examples of these different data access categories, from those that are easiest to locate, to the ones most difficult to access.
Open data
When data is open, it typically does not cost any money to access it via the internet. Open data can also be available in print because (1) it existed before the internet, and (2) to be available to people who do not have reliable access to the internet. Below are some, but not all, sources for open data, grouped by categories of data producers.
Government
All levels of government (federal, state, local) produce troves of data to enlighten government officials’ decisions and policies, to document oversight of entities and individuals, and to inform the enforcement of regulations. Much open government data is aggregated, macro-level (not identifying individuals), while other open government data is available at a micro-level (identifying individuals) as records for public inspection.
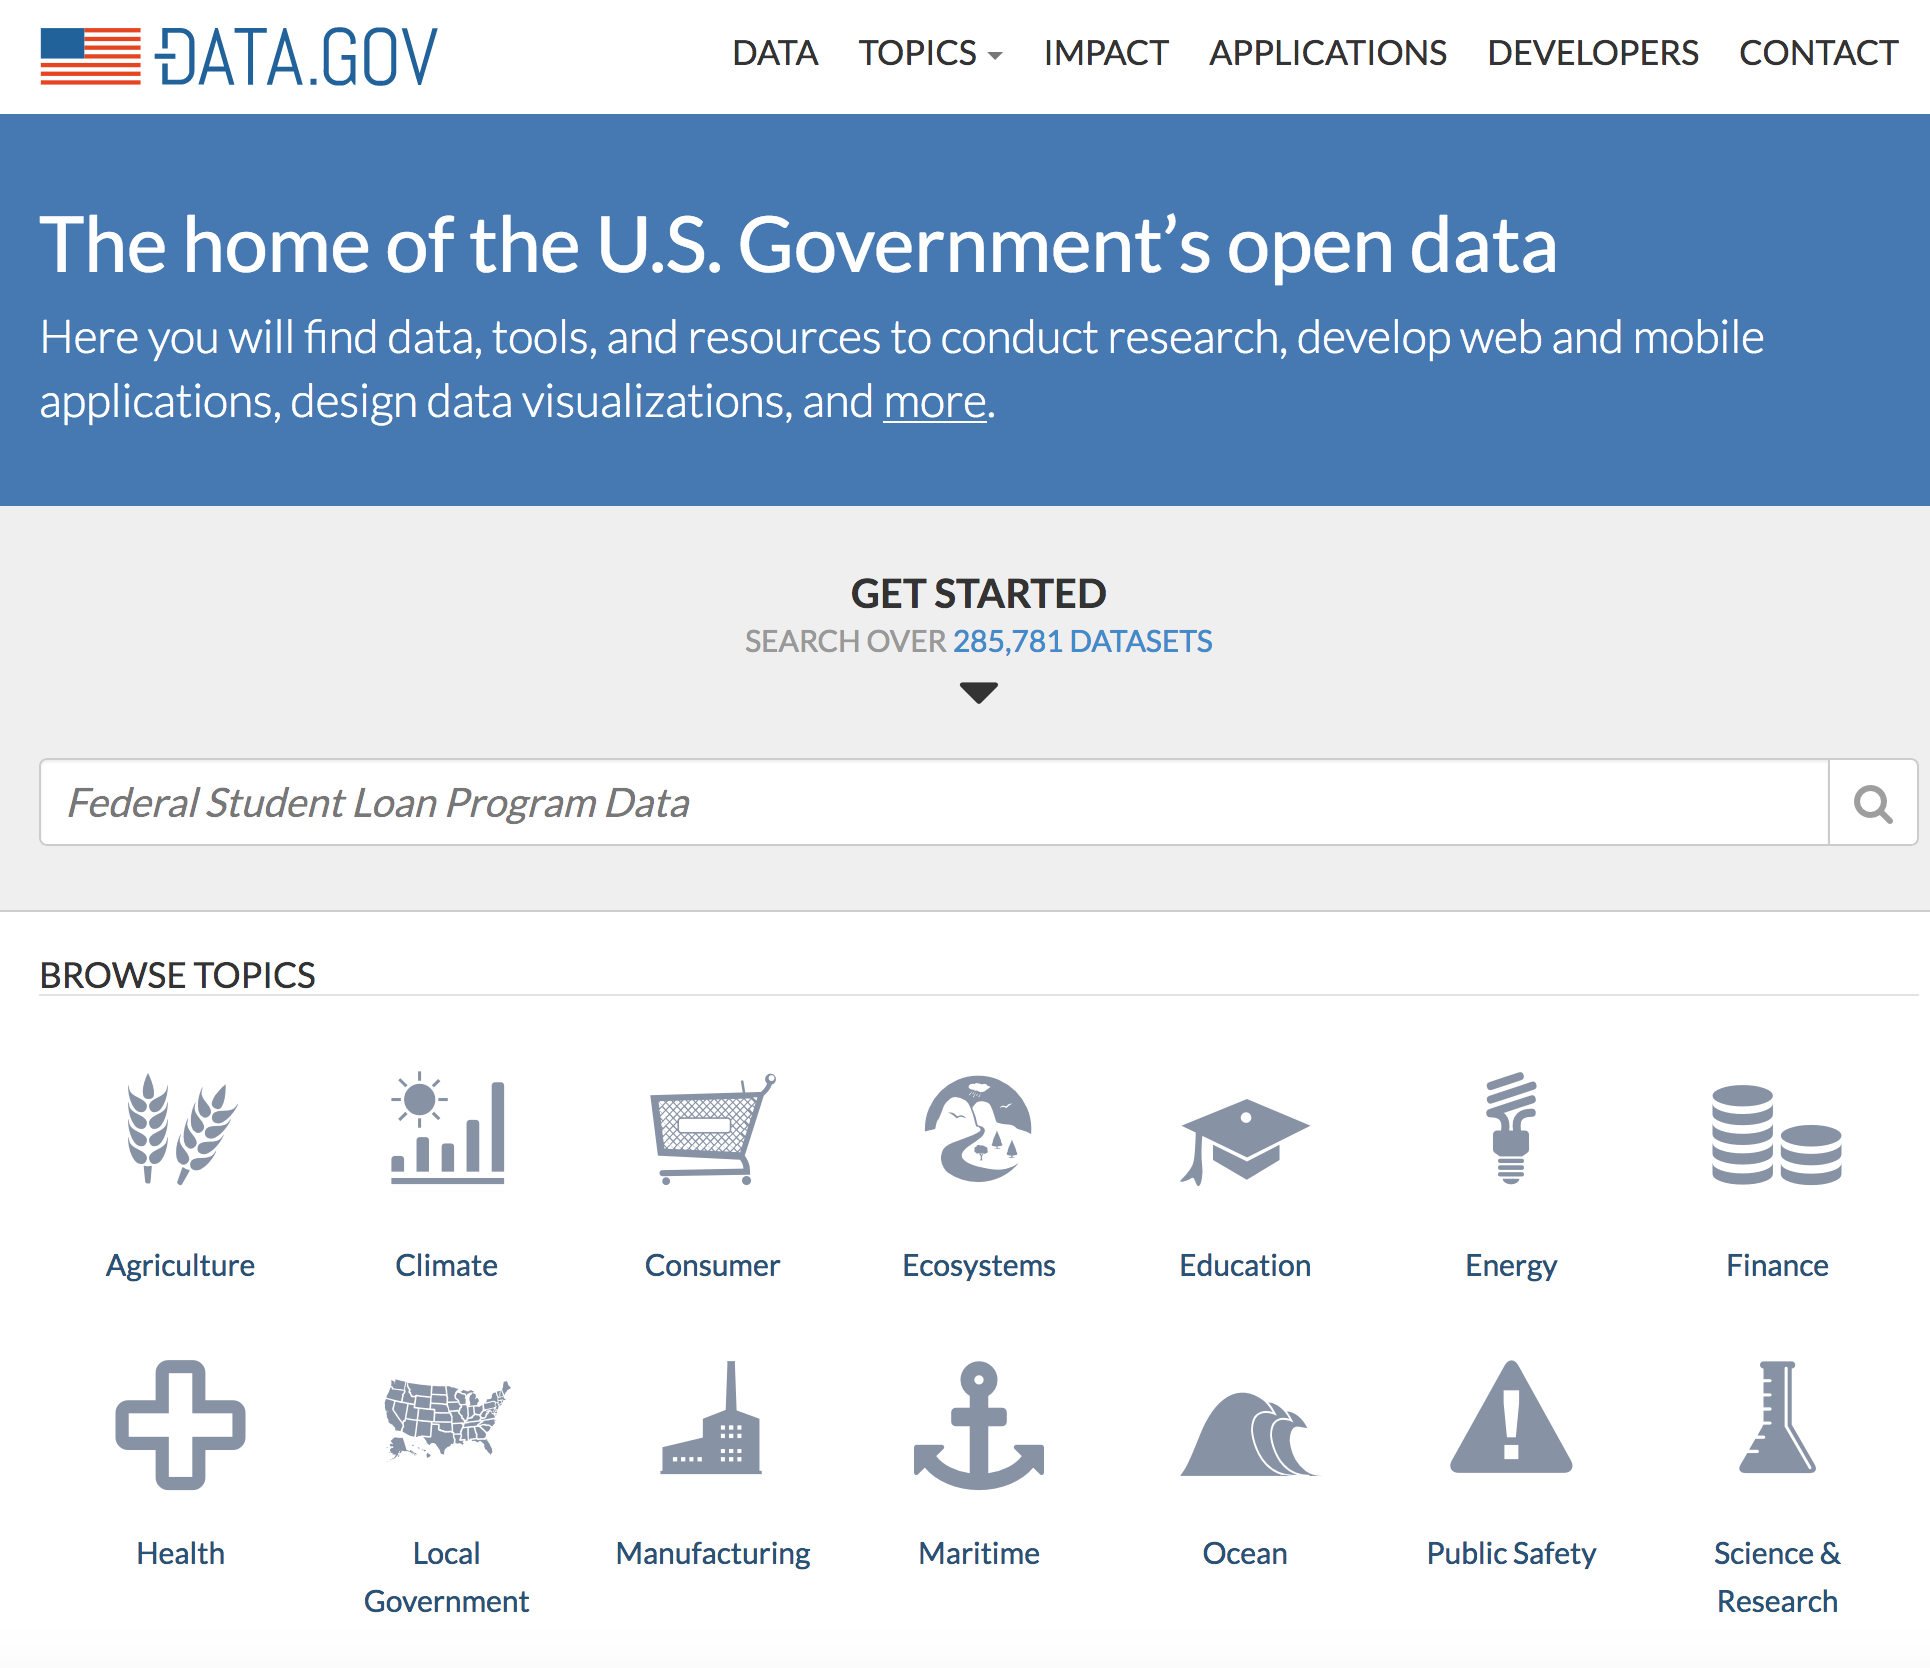
The website Data.gov is a portal to hundreds of thousands of data sets created by various government agencies across the country. Users can enter keywords into a search bar to find data sets related to their topics, or browse datasets grouped into 14 broad categories. The portal links users to data sets that reside on the websites of the various government agencies that create them.
In addition to Data.gov, it can be useful to search the individual websites of these government agencies. Here’s a very select list of government data sources:
- Kansas Department of Revenue
Check out financial statistics at the state, county, and city levels, place an open records request for such things as a driving record, and all things related to taxes (property, sales, liquor, life, and death). - United States Census
Every 10 years the US government surveys the U.S. population to determine how many seats a state may have in the U.S. House of Representatives. Census takers tell the government about who people in the U.S. are (race, ethnicity, sex, age), where they live and with whom, and whether they rent or own their abode. Questions for the census have changed over the years, but these are some of the basics that help you understand more about the population in a general sense. - American Community Survey
Conducted annually, this survey helps determine the distribution of state and federal funds. Learn about jobs, educational attainment, veterans, and housing in communities. - United States Economic Census
Conducted every five years, this Census covers the small to big business in a variety of industries across the United States. It is helpful when you want to learn more about revenue streams for industries or the gross national product. - Census of Agriculture
Data on farms and ranches, farmers, crops, and livestock. The census is conducted every five years. - National Center for Education Statistics
It’s got it all from K-12 through college. Turn to this source to analyze college costs, school characteristics, drop-out rates, retention, and school and student performance by state. - Bureau of Labor Statistics
The BLS is known best for the national unemployment rate it releases every month. The Bureau’s Occupational Outlook Handbook contains in-depth numbers about every occupation, including starting and median wages, and employment need projections. - Bureau of Justice Statistics
Data about law enforcement, the justice system, crime, and criminals. - U.S. Department of Housing and Urban Development (HUD)
Data on housing and housing costs, including government-supported housing.
Other organizations
Similar to open government data, other organizations collect data and make the data discoverable and accessible to the public. These organizations include non-governmental organizations (NGOs) such as nonprofits (foundations, associations, societies, charities, etc.), as well as for-profit corporations.
- Kansas OpenGov
Data about government spending in Kansas, including the entire state employee payroll. Other categories include school district, city, and county data. - Pew Research Center
Pew is one of the most respected private research organizations in the United States. It is funded by The Pew Charitable Trusts, which was established initially by a wealthy oil family. The center consists of several distinct units, including ones that research Politics & Policy, Journalism & Media, Social Trends, Internet & Technology, and Religion & Public Life. Each of these units regularly releases research reports, and the datasets on which these reports are based. - OpenCorporates
Brought to us by information from the World Bank Institute, OpenCorporates contains data about global companies. You can browse and search for specific companies and judge how well countries are faring in requiring companies to share their data. - globalEDGE: Your source for Global Business Knowledge
Draws on more than 5,000 open data sources to create a user-friendly tool to discover and compare history, demographic, economic and political data by state and by country. - Open Elections
Aims to turn all US election results into useable data. Its process involves converting handwritten county-level poll results into comma-separated value (CSV) files so that journalists may download election data to handy spreadsheets and crunch some numbers. Check out Open Elections’ GitHub site to see the raw and in-progress data. - Open Secrets
Allows you to look up who and which interest groups have made political donations, and to whom. Additionally, its staff provides timely and topical research reports on recent topics, such as the Women’s March on Washington or how much money Facebook Inc. has given to the lawmakers who interrogated Mark Zuckerberg after a data breach. Finally, it also contains educational articles so that you can learn the ins and outs of political donations. - Transactional Records Access Clearinghouse (TRAC) Immigration Project
Syracuse University houses this project that obtains U.S. government information regarding immigration through Freedom of Information Act requests, fact checks the information, and then makes it available to the public through reports or easy to use tools. With TRAC’s materials, you can drill down to the county level to understand big issues like deportation, Immigration and Customs Enforcement (ICE) raids and arrests, and immigration court activity. - Google Trends
Find out what topics and news stories Google users are searching for across many countries. Google also provides visualizations for these analytics, which are searchable by topic and date. - Twitter Trends
Many journalists and marketing professionals follow what’s trending on Twitter to develop relevant stories and campaigns. - YouTube Data Viewer
Amnesty International created this tool to check who and when someone uploaded a video to YouTube. Such data can help you determine the credibility of a YouTube video.
Privileged Data
We use the term privileged data to describe data that is not freely accessible. This data is available to you because you are in a privileged position. This privileged access might come from being a student at the university, an employee of a corporation, or from another means of privilege.
Let’s consider your privilege as a student. The University of Kansas Libraries pays companies for access to their resources. These resources may contain data that is privately owned by marketing companies or other businesses. These resources also may present publicly available data in a new way, such as mapping U.S. Census data to provide data visualizations.
As a student, you have free access to all of these resources. That’s your privilege. Once you separate from the university, you will no longer have access to this information unless you physically come to the library and use one of the public computers. Your future employer may subscribe to some of these databases, but you should enjoy them while you have access to them at the university.
The following databases are examples of what’s available through the KU Libraries website. Click “Articles and Databases” in the Find box, which is in the middle left side of your screen.
- Mintel
Mintel is a company that compiles and analyzes data on consumer and industrial markets. These reports are short, simple, visually appealing, and easy to digest. When using Mintel, make certain you pay close attention to the fine print on a piece of information. This is where Mintel will tell you where the company got the information. If possible, it is always good to track it down to the original source, such as the U.S. Census or Pew Research Center. (This textbook includes a video on how to use Mintel.) - eMarketer
Research consumer trends and behaviors here. You can focus your search on a specific topic, industry, audience, or country. Like Mintel, eMarketer produces short and digestible reports. Also, you can export their data to an Excel spreadsheet and download chart images. - Social Explorer
Social Explorer maps demographic data to give you and your audience a visual understanding of your argument. You can easily download data and visuals from Social Explorer, which is why news giants like The New York Times use it. Bonus: You can also annotate your maps with your scribbles, photos, and more.
Closed Data
Closed data is not open or easily accessible. Instead, it is privately held by companies, the government, and individuals. While it can be frustrating as a researcher not to have access to such data, it is important to consider the reasons why such data is not freely available.
Why some data is off limits
Money, money, money
According to OpenCorporates, the United States scores 31 out of 100 for open company data. This is because people typically can only find basic information about private U.S. companies. Moreover, this information usually isn’t downloadable, and it doesn’t include some basic information like shareholder names.
Searchable data is available only from publicly traded companies. If a company is publicly traded, the U.S. Securities and Exchange Commission requires the company to make some information available, such as annual reports (also called 10-Ks). Privately held companies are not required to participate in such show-and-tells, so they usually don’t, and there virtually is no private company data available for public use.
Just because you cannot access a company’s private data doesn’t mean nobody can. Many companies are willing to sell their data and their consumers’ data for a price. Companies may sell consumer data to some of the privileged sources we discussed above, or to other companies, such as those discussed in the chapter on Google.
The business of consumer data is very lucrative, and the average consumer often does not realize that “when an online service is free, you’re not the customer. You’re the product,” according to Tim Cook, Apple CEO and vocal critic of Google and Facebook. Cook again criticized these companies in 2018, during the unfolding of Facebook’s Cambridge Analytica scandal, which revealed that Facebook users’ data were appropriated to aid the Trump campaign. This time, Cook promised that Apple could make a “ton of money” if it trafficked in its users’ data, but said that it refused to do so because he believes data privacy is a human right.
Privacy
When companies release their customers’ data intentionally to researchers or other companies, chaos and a whole lot of bad publicity can follow. For instance, back in 2006, AOL released the search data of anonymized users as part of a new initiative to aid academic research. Information scientists specializing in information retrieval downloaded the data in hopes of improving information retrieval systems, or designing more effective and efficient search engines.
Here comes the bad news. The data revealed people’s habits, hobbies, interests, and other seriously embarrassing stuff that marketing companies were dying to find out. And even though the data was anonymized, it took The New York Times little time to identify a user and run a big story about how easy it was. This was so not good, considering the data revealed people and their searches for private issues that they were too embarrassed to ask another human being. AOL pulled the data and apologized before being sued for breach of privacy. The bad thing is, once such data is released, there is no stopping who has access to it. Even though AOL took down the data, more than 10 years later, some researchers who had already downloaded it continue to hang on to it.
Using Data Responsibly
Through your work, you may encounter a variety of the data listed above. You may also encounter data when a source or your boss provides you with basic figures, such as the cost of a new city initiative, or how much money your organization has fundraised. Whether you are dealing with small or big data, you should use it responsibly.
Be data literate
The first step to using data responsibly is to become data literate. Data-literacy “is the ability to consume for knowledge, produce coherently and think critically about data,” wrote data journalist Nicolas Kayser-Bril in the “Data Journalism Handbook.” Becoming data literate isn’t as daunting as it may sound, though. To be a data expert, Kayser-Bril recommends asking three questions.
- How was the data collected?
Kayser-Bril cautions to always check the source of your data to make certain that it is credible. Additionally, if you come across numbers that sound too good to be true or just seem off, then they probably are. It’s always good to verify numbers against other sources. In The Washington Post’s story about homicide rates we discussed earlier, for instance, reporters didn’t just rely on the numbers. They contacted family and friends of victims, residents, and local police to verify that homicides were unsolved. In other words, it is important to think critically about the information and question its accuracy. - What’s in there to learn?
Don’t take everything at face value. Check the mean, median, and mode of a study’s results to make certain you are not misleading people. For instance, one in 15 million Europeans may be illiterate, Kayser-Bril cautioned, but the same number of Europeans also are under the age of 7. Likewise, report data in terms of magnitude and not percentage, to convey how representative a study is. Write one in 100 instead of 1 percent, the data journalist advised. - How reliable is the information?
First, Kayser-Bril believes the reliability of data can often depend upon the research study’s sampling size, or the size and number of the subjects under study. For example, a survey may have a sample size of 1,000 people. When evaluating a study, keep an eye out for the margin of error, which ideally should be 3 percent or below. “It means that if you were to retake the survey with a totally different sample, 9 times out of 10, the answers you’ll get will be within a 3% interval of the results you had the first time around,” Kayser-Bril explained. Second, even if the sampling size and margin of error is reliable, you can always question if the researchers have successfully pinpointed the true cause of their results. We’ll discuss cause and causality more below.
Bias
It seems as though we just cannot get away from bias. If you use information from any government, it can carry a nationalistic bias. A for-profit company can produce data that makes the company look good (corporate bias). A not-for-profit organization may have some benefactor it may want to make happy with its numbers.
Some data sources may oversimplify information so that it is easily digestible for their readers, or only produce data that people will want to buy. In other words, all those privileged data sources we mentioned above, like Mintel and eMarketer? Those companies’ agendas are to make money from the data they sell, and those agendas can influence the way these companies produce and present these data.
We realize that we may make it sound like you just can’t trust anyone or anything, right? Well, the point is that you should be skeptical about what you read, but not to get so jaded that you become a cynic, as veteran journalist Roy Peter Clark recommended. Being skeptical allows you to recognize some biases or shortcomings of the data you are using and to find alternative information to balance it out.
For instance, if you are reporting on high school dropout rates by race, you would want to use numbers from the National Center for Education Statistics. But you would realize that this source can only give you the number of people who did not return to school, but not the reason why students left. This is because this source is limited by national reporting standards in education. That is, schools and school districts are required to report numbers to the states, and then to the NCES, but they are not required to report qualitative data that provide context for these numbers. As a result, you would want to interview students, teachers, or principals to get better insights into the causes for individual student dropouts. Drilling down to the individual level would balance the national perspective.
To help you avoid the pitfalls of bias, you should always chase down the original source of information, and research that source. The original source may be written as footnotes and endnotes in teeny, tiny print on a Mintel infographic, for instance. Also, remain aware of your own implicit and explicit biases, and try to keep those in check. Include and discuss material that runs contrary to your thinking to reassure your reader that you are considering all possible angles. Finally, revisit our bias chapter for a quick refresher.
Correlation versus causation
Often when we are searching for an answer, we are not as skeptical as we should be because we have a deadline and we’re busy. If we are researching how to boost revenue generated by arcades for a client, for instance, we may stumble upon the following graph:
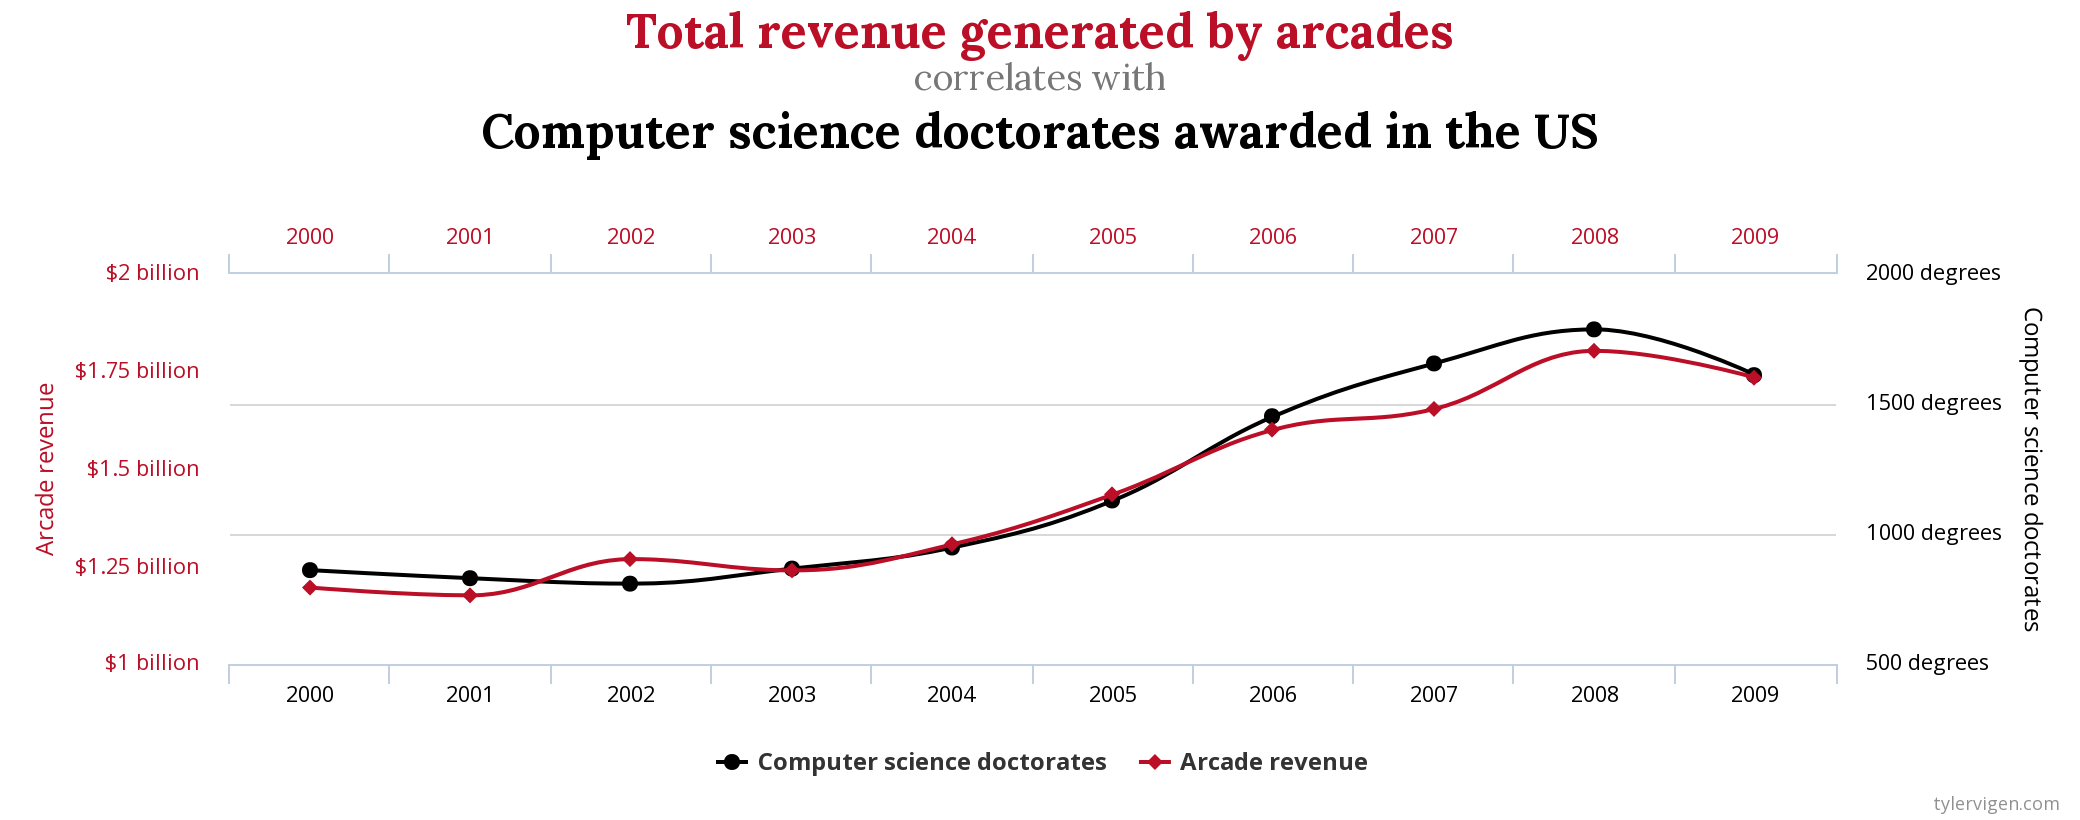
This graph is one of hundreds of spurious correlation graphs presented on the website TylerVigen.com. This graph shows that increases and decreases in arcade revenue closely match the increases and decreases in the rates at which people get doctorate degrees in computer science. The numbers don’t lie, right?
Well, if we think about it, there really isn’t a way we can prove that the graduation rates of computer science Ph.D.s causes a rise in arcade revenues. While the two rates are correlated, or rise and fall at similar rates and similar times, we do not know for certain that one is causing the other to happen.
Most correlations we deal with in real life aren’t as ridiculous as this one. But too often, our confirmation bias kicks in anyway, and we accept an interpretation of data because it seems to make sense and agrees with our thinking.
If you aren’t an expert in statistics, you are not alone. Don’t be afraid to ask someone to fact-check your findings. You may also watch this Khan Academy tutorial to learn more, or read the Data Journalism Handbook.
Conclusion
What we have covered is only a tiny sampling of the world of data. Becoming data literate is an ongoing process, and we encourage you to continue to explore different data resources and tools through real-life situations and online communities, such as The Data Journalism Den, or the data journalism Slack team, and the Data Journalism Handbook or Stokes’s eMarketing textbook.
Peer Tutorial: Visualizing Data
In the following video, Courtney Saysiri (JOUR 302, fall 2019) demonstrates how to find and visualize data about passenger traffic at Kansas City International Airport.
Activity 1: Existing Resource Tutorial
Create a tutorial of one of the data resources presented in this chapter. Explore the resource’s search functions, information, ease of use, limitations, and other positive and negative features. Your tutorial should demonstrate how to use the tool efficiently and effectively. Your audience for the tutorial is one of your fellow classmates. You may use whatever technological tool you wish to create your tutorial, which should run approximately 2-3 minutes.
Activity 2: New Resource Tutorial
Identify and create a tutorial for a source that is not presented in this chapter. Explore the resource’s search functions, information, ease of use, limitations, and other positive and negative features. Your tutorial should demonstrate how to use the tool efficiently and effectively. Your audience for the tutorial is one of your fellow classmates. You may use whatever technological tool you wish to create your tutorial, which should run approximately 2-3 minutes.
Activity 3: Data Research
Use one of the resources presented in this chapter to research your topic. Write a one-page synopsis of your findings. In the first paragraph, summarize your process of finding and accessing the information you found. In the second paragraph summarize the information you found. In the remaining paragraphs, detail why the information will be useful to your project, and how it relates to other information you have found.
