
9 Chapter 9 – Accounting and Cash Flow
Understanding the Need for Accounting Systems
The older I get, the more interesting I find lawyers and accountants. – Alex James[1]
Imagine that you invite a friend from China, who is visiting the United States for the first time, to a baseball game. Your friend has never been to a baseball game before and knows nothing of the game’s rules. He might notice on the scoreboard listings for runs, hits, and errors. Your friend might also see notations on the number of strikes and balls. He does not know exactly what any of those terms mean, but he notices that some people in the stands applaud when the number of runs increases. Your friend might be amused by seeing individuals periodically running from one base to another; however, without knowing the basic rules of baseball, he cannot possibly understand what is actually occurring. He certainly could not comment on how well the game is going or provide suggestions about what one of the teams should do next. Most Americans would be in the same position if they were watching a cricket match. In both cases, you and your friend are in the same position of someone who wishes to run a business without having a fundamental understanding of accounting systems.
Warren Buffett has said that accounting is, to put it simply, the language of business. Without a fundamental understanding of this language of accounting and its set of rules, you are in the same position as your Chinese friend—you really do not know what is going on with a business. If someone is considering starting a business, he or she should possess some degree of fluency in this language. One does not expect this businessperson to be as knowledgeable as a certified public accountant (CPA) or an expert in tax issues. However, such businesspeople should have a clear expectation that they will be able to look at the key elements of an accounting system and interpret how well their businesses are doing. They should be able to track some of the key tasks and elements associated with a comprehensive accounting system.
Accounting is defined by the American Institute of Certified Public Accountants (AICPA) as “the art of recording, classifying, and summarizing in a significant manner and in terms of money, transactions and events which are, in part at least, of a financial character, and interpreting the results thereof.”[2]Put more simply, it is essentially an information system. Accounting provides critical information to potential investors and business managers. Accounting may, in fact, be one of the oldest information systems known to humans. Some have argued that accounting systems were the impetus for the development of writing systems in Mesopotamia.[3] Archaeologists have discovered clay tokens, dating back 10,000 years ago, which functioned as part of the inventory system measuring agricultural goods, such as grains and domesticated animals. By 3500 BC, these tokens were being stored in containers—known as bullae. Notations on the surface of these containers indicated the type and quantity of the tokens held within; for many, this system was the basis of an abstract system of written communication.[4]
Other ancient societies recognized the importance of carefully monitoring and recording economic transactions. The Roman Empire needed to finance its operations and employed the familiar concept of an annual budget to coordinate expenditures and taxation. It had treasury managers, known as questors, who were subject to periodic audits.[5] The most famous monograph on accounting dates to Renaissance Italy. Luca Pacioli, a Franciscan friar and polymath, wrote Summa de Arithmetica, Geometria, Proportioni et Proportionalita in 1494. Essentially this was a math textbook, but it included a section on double-entry bookkeeping. This approach to accounting had been covered by Beredetto Cotrugli a century earlier.[6] The text was immediately recognized as an important contribution and was one of the first books produced by Gutenberg. On a first reading, Pacioli’s coverage appears to be remarkably “modern.” It described how merchants should identify their assets and liabilities, note transitions as they occur, and identify them as either debits or credits. He pointed out that the total of debits and credits must be equal, thus his model became the basis of the balance sheet. In the intervening five hundred years, business has essentially adapted Pacioli’s approach. Obvious, over the last five centuries, businesses have grown both in size and in complexity, and accounting systems have grown with them. Therefore, it is important for any business regardless of size to be able to “count” on solid accounting information.
The exact nature of accounting support will be greatly determined by the type and size of the small business. The level of accounting support required by the nonemployer business will obviously differ significantly from the level required by a business generating tens of millions of dollars of revenue and employing hundreds of workers. The level of support will also be influenced by the business owner’s familiarity with accounting and the type of accounting information systems that have been determined as appropriate. Regardless of size or type, small businesses should plan on eventually acquiring the talents of an accountant. Preferably, the decision to use an accountant should occur with the creation of the business.
Hiring an accountant or an accounting firm is an important decision for a small business. Employing an accountant does not translate into this individual being a full-time employee of the business. At the start, most small businesses will use the accountant as a consultant or a contract employee. As they grow, some small businesses might benefit from acquiring the services of full-service accounting firm. Although some start-ups, particularly those that might be cash-strapped, use the services of the bookkeeper only, but this is ill-advised. Most small businesses will need the services of a CPA. Another type of accountant a small business might employ is known as an enrolled agent. These are accountants who have passed a tax test from the Internal Revenue Service (IRS).
When looking for an accountant, there are some issues that you should consider. Try to find an accountant who has some working familiarity with a particular type of business or industry. Hopefully, you will be able to find an accountant with whom you have some rapport. This is important because a good accountant is more than simply someone who balances the books. You should consult an accountant before determining what type of accounting system you intend to employ—cash versus accrual. Remember that an accountant will play an important role in assisting you in the creation, purchase, and development of an accounting information system for the business. This system is important in providing the appropriate information to the external community (for this audience the term financial accounting is often used)—bankers, angel investors, venture capitalists, and/or the government. The same accounting information system will also be an important component of internal controls (in this case the term managerial accounting is used)—the systems and policies by which you make a firm more efficient. In this role, an accountant can help develop appropriate policies with respect to cash control and inventory control. An accountant can play a critical role in developing business plans, particularly with respect to budgets and financial statements. As highlighted in a future section, you should consult an accountant before selecting an accounting software package. Quite often, an accountant can be extremely useful in training people to use such a software package.[7]
Alternative Approaches to Accounting Systems
The system of double-entry bookkeeping is, perhaps, the most beautiful one in the wide domain of literature or science. If it were less known, it would be the admiration of the learned world. -Edwin T. Freedley[8]
The evolution of accounting has led to two major systems: the cash basis model and the accrual basis model. Before describing the two systems, we must identify a very important term—accounting transactions. When in business, we either receive money from a sale or spend money, such as in buying a piece of equipment. We can define these as transactions. The manner in which we record transactions defines the difference between a cash basis accounting system or an accrual accounting system.
In most cases, either system can be used by a business (there are situations under which a cash-based accounting system cannot be used, the details of which are discussed later), but regardless of the system used, a business must clearly specify which method is being employed.
In the cash-based accounting system, a transaction is recorded when money is either received or spent. As an example, a business has three sales on June 29 of a particular year. The first sale is for $500, the second is for $1,000, and the third is for $300. However, the three customers use different methods of payment. The first customer pays for the product in cash, the second customer writes a personal check, and the third customer pays by credit card. The second customer’s personal check clears on July 5, while the credit card company transfers the $300 into the business’s account on July 3. Under the cash basis accounting system, the business would list the first sale of $500 as a June transaction, but it would list the second and third sales (totaling $1,300) as July transactions. The same logic is used with respect to expenditures. If the same firm purchased a laptop computer in July but did not have to pay for two months, then the transaction would be recorded in September.
Under the Accrual accounting system, transactions are recorded when they occur. If the aforementioned business was functioning under the accrual basis accounting system, then all three sales (totaling $1,800) would be recorded as June transactions, and the purchase of the laptop would be designated as a July transaction.
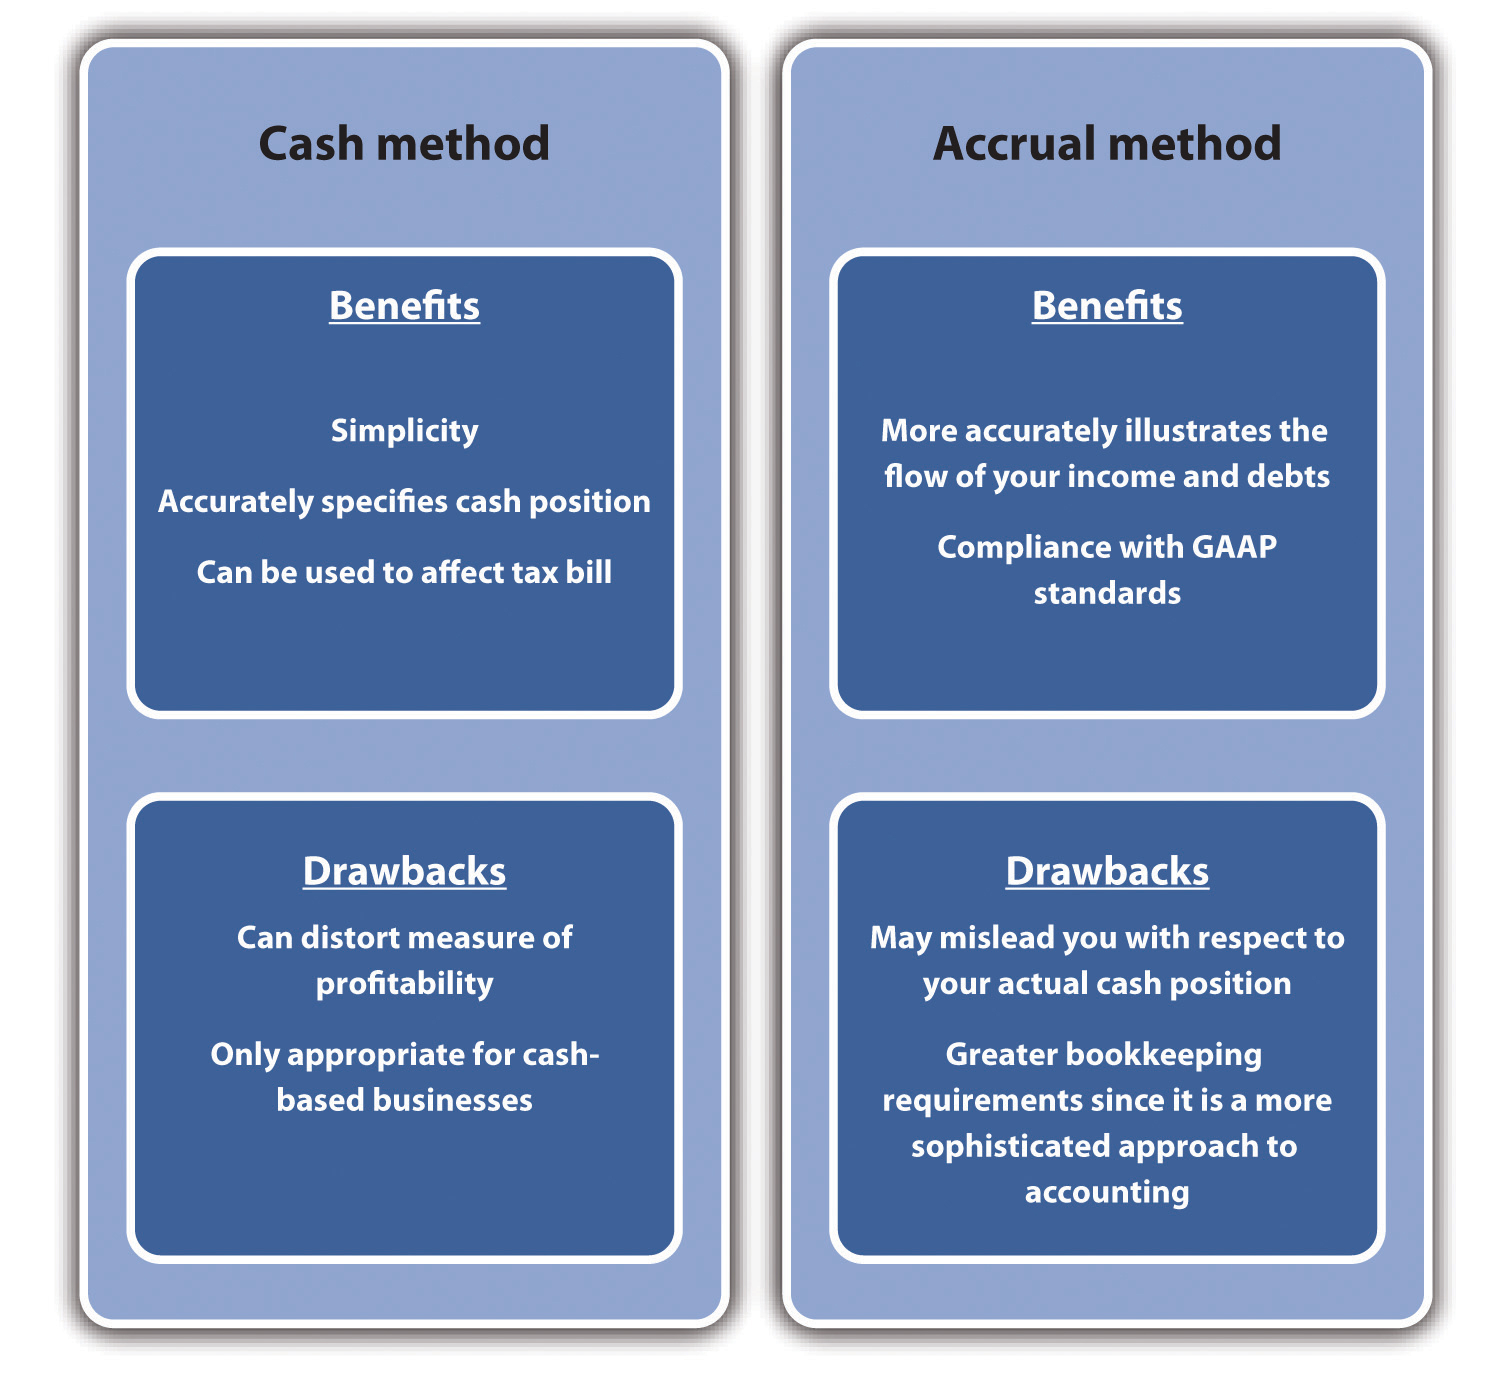
Generally, though, with some few exceptions, businesses must use the accrual basis accounting method if they have inventory of any component of items that they sell to the public and if the sales are more than $5 million per year. Other conditions under which the cash basis accounting system may not be used include C corporations, partnerships with at least one C corporation partner, and tax shelters.[9] The major benefit of cash basis accounting is its simplicity. It greatly reduces the demand on bookkeeping. The cash basis system also provides a much more accurate indication of a company’s current cash position. This approach may be used to affect taxable income, which can be done by deferring billing so that payments are received in the next year.[10] However, there are drawbacks to the cash basis approach—the most serious being that it may provide a distorted or an inaccurate indication of profitability. The reality is that cash basis accounting systems are really only appropriate for businesses with sales under $1 million and that function basically on a cash basis.
Accrual basis accounting is in conformance with IRS and generally accepted accounting principles (GAAP) regulations. Although more complex and generally requiring greater bookkeeping with a more sophisticated approach to accounting, the accrual basis provides a more accurate indication of the profitability of a business. The major drawback of the accrual basis system comes with respect to understanding the business’s cash position. A firm may look profitable under this system, but if customers have not paid for the goods and services, the cash position might be dire.[11] A summary of the pros and cons of the two systems is provided below.
Comparative Accounting Systems
Key Takeaways
- Accounting is one of the oldest activities of human civilizations and dates back over five thousand years.
- Small businesses require accounting capabilities, which must be done either in-house or through an external service.
- The selection process for an accounting service should be carefully considered. The evaluation process should consider the following: expertise in a particular type of business or industry, rapport, availability of additional consulting services, and the ability to support computerized accounting systems.
- Accounting systems may be divided into two major types: cash basis and accrual basis.
- Cash basis systems count a transaction when the cash is received. Such systems are used by smaller businesses that have no appreciable inventory.
- Accrual basis systems count transactions when they occur. Although this system may require additional analysis to determine a business’s actual cash position, it provides a more accurate measure of profitability.
Financial Accounting Statements
It sounds extraordinary, but it’s a fact that balance sheets can make fascinating reading. -Mary, Lady Archer of Weston[12]
As discussed in Chapter 5, all business plans should contain sets of financial statements. However, even after the initial business plan is created, these financial statements provide critical information that will be required for the successful operation of the business. They not only are necessary for tax purposes but also provide critical insights for managing the firm and addressing issues such as the following:
- Are we profitable?
- Are we operating efficiently?
- Are we too heavily in debt or could we acquire more debt?
- Do we have enough cash to continue operations?
- What is this business worth?
There are three key financial statements: the balance sheet, the income statement, and the cash-flow statement. Every business owner or manager needs to be able to correctly interpret these statements if he or she expects to continue successful operations. It should be pointed out that all three financial statements follow general formats. The degree of detail or in some cases terminology may differ slightly from one business to another; as an example, some firms may wish to have an extensive list of operational expenses on their income statements, while others would group them under broad categories. Likewise, privately held businesses would not use the term shareholders’ equity but rather use owner’s equity in their balance sheet, and they would not list dividends. This aim of this chapter is to provide the reader with a broad overview of accounting concepts as they apply to managing small and mid-sized businesses.
The Balance Sheet Statement
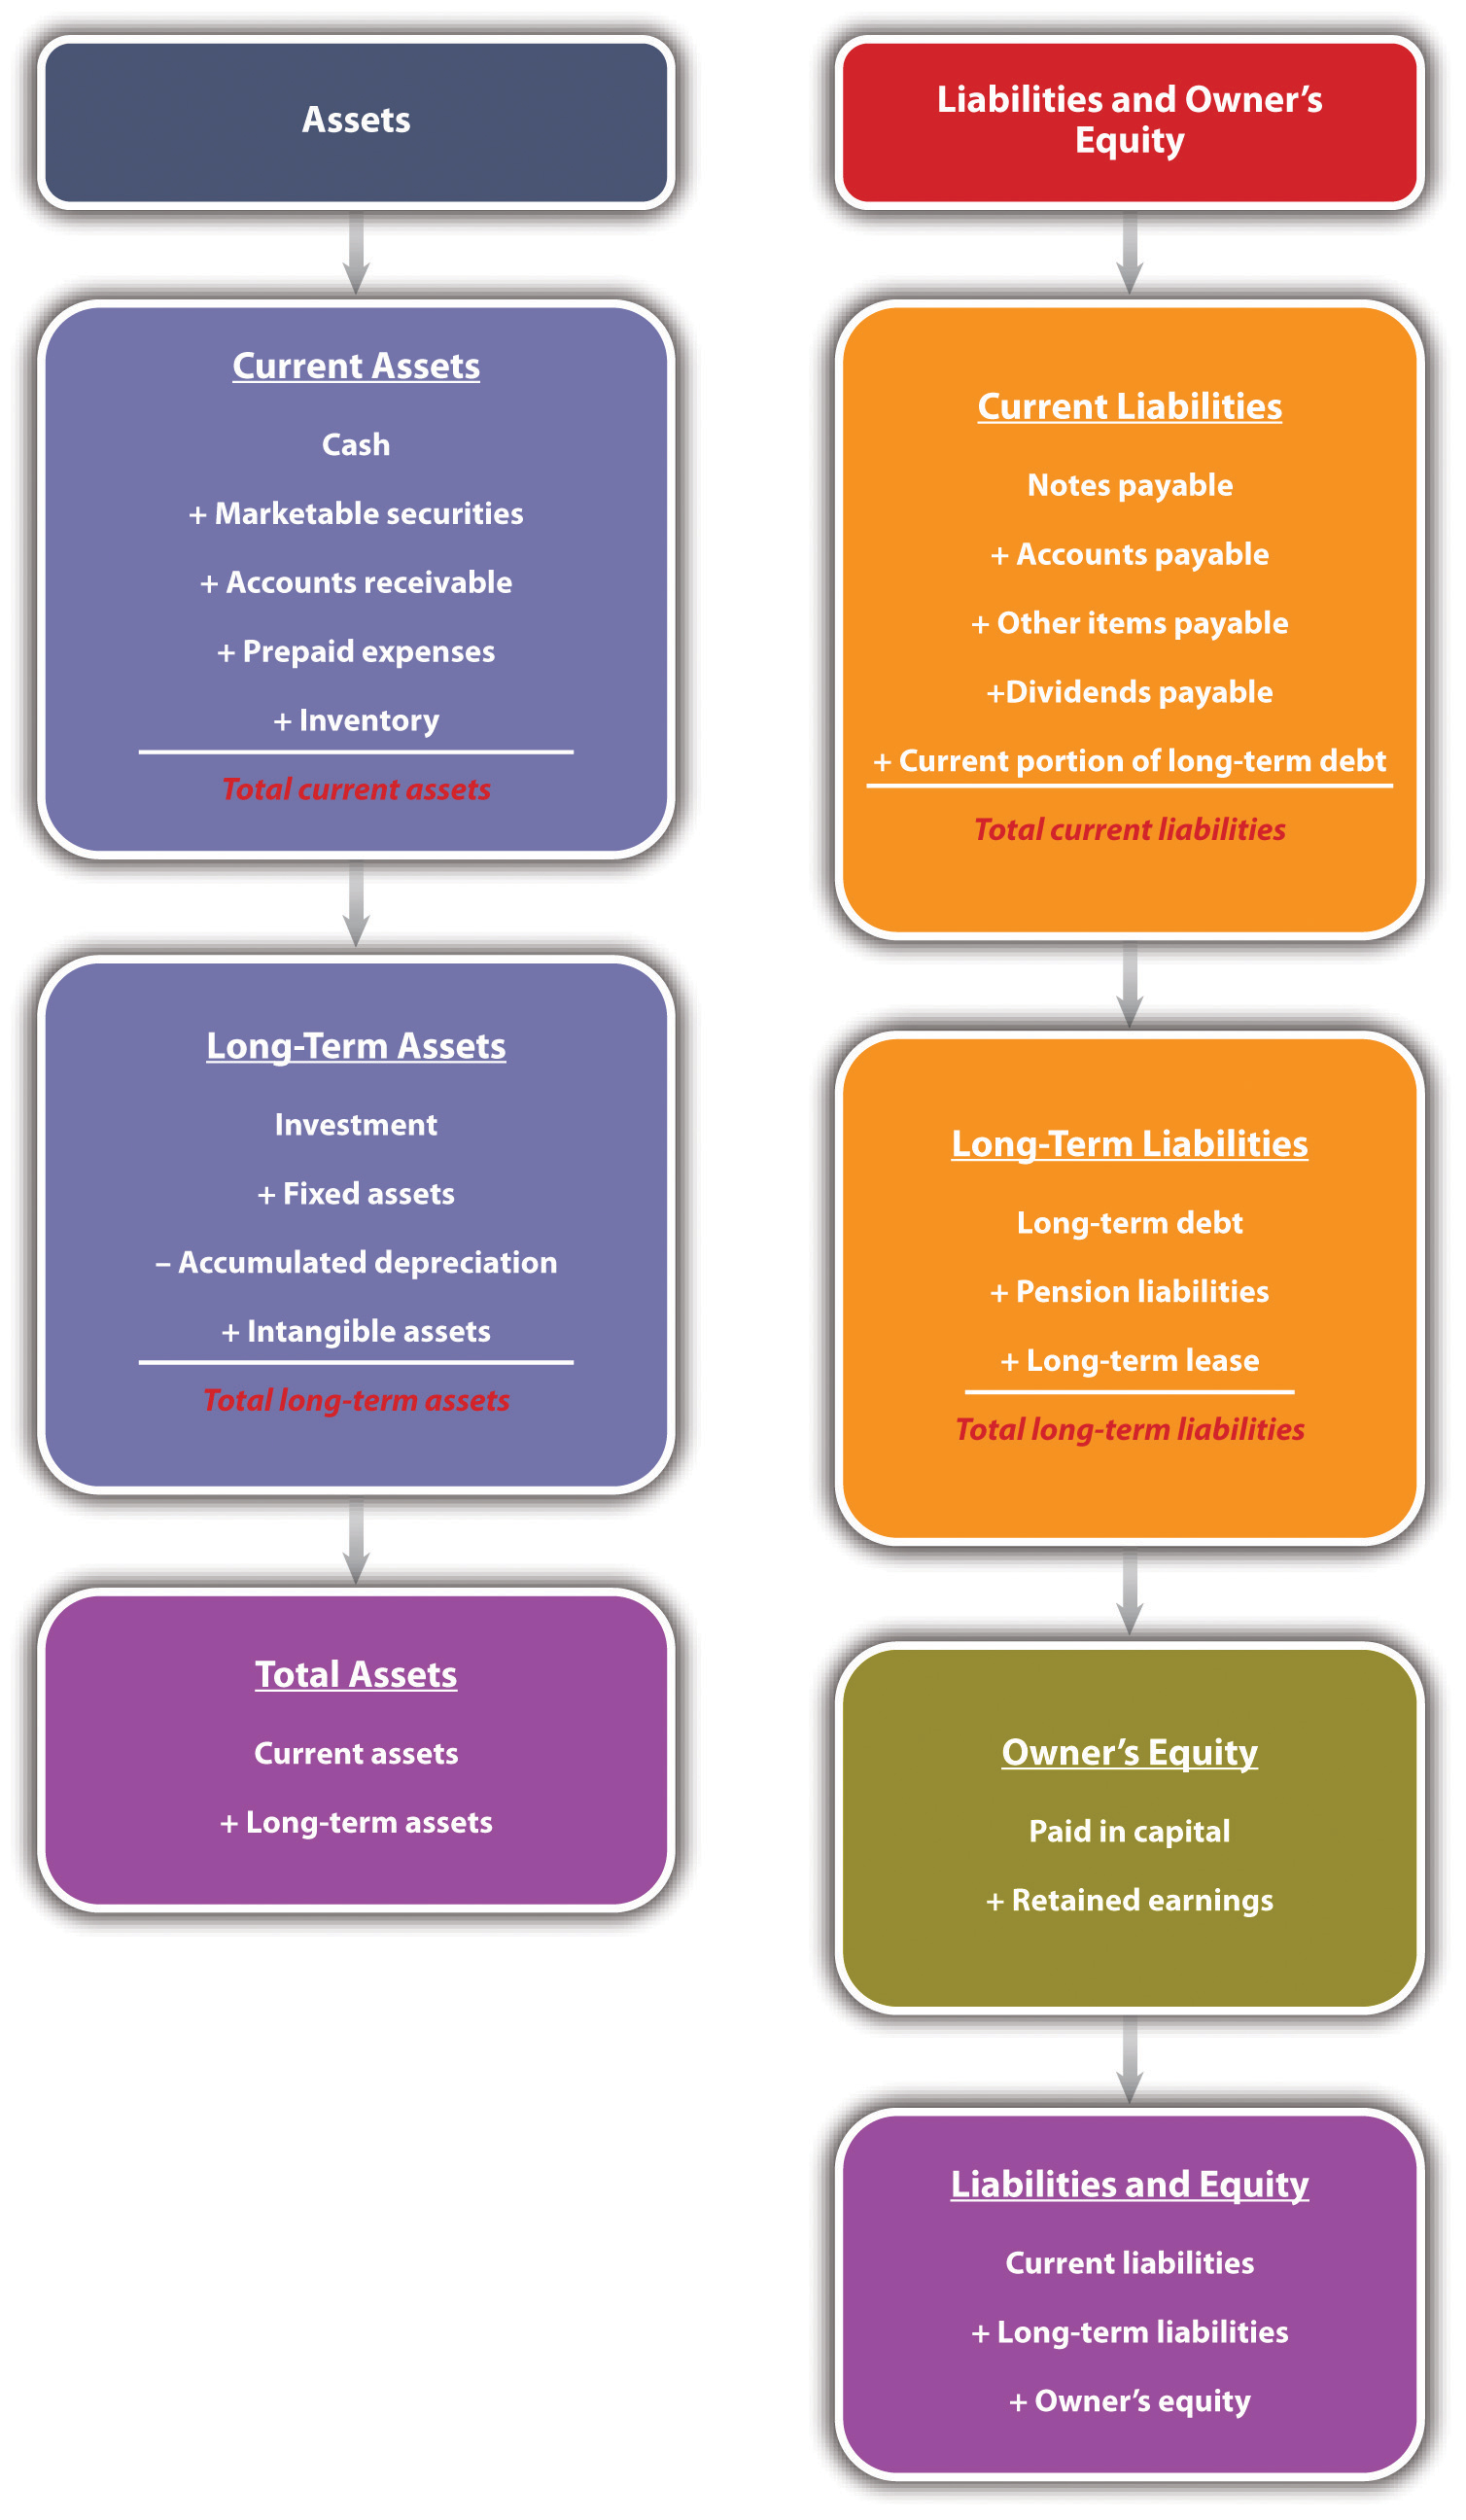
One should think of the balance sheet statement as a photograph, taken at a particular point in time, which images the financial position of a firm. The balance sheet is dominated by what is known as the accounting equation. Put simply, the accounting equation separates what is owned from who owns it. Formally, the accounting equation states the following:
assets = liabilities + owner’s equity.
Assets are “economic resources that are expected to produce a benefit in the future.”[13] Liabilities are the amount of money owed to outside claims (i.e., money owed to people outside the business). Owner’s equity—also known as stockholders’ equity—represents the claims on the business by those who own the business. As specified in the accounting equation, the dollar value of assets must equal the dollar value of the business’s liabilities plus the owner’s equity. Before proceeding with any numerical example, let us define some important terms.
Current assets are assets that will be held for less than one year. They include cash, marketable securities, accounts receivables, notes receivable, prepaid expenses, and inventory. These are listed in a specific order. The order is based on the degree of liquidity of each asset. Liquidity measures the ease in which an asset can be converted into cash. Naturally, cash is the most liquid of all assets. All firms should have cash readily available. The exact amount of the desirable amount of cash to be held at hand will be determined by the sales level of the anticipated cash receipts and the cash needs of the business.
Marketable securities are stocks and bonds that a business may hold in the hope that they would provide a greater return to the business rather than just letting cash “sit” in a bank account. Most of these securities can be easily turned into cash—should the need arise.
Accounts receivables represent the amount of money due to a business from prior credit sales. Not all firms operate on a strictly cash sales basis. Many firms will offer customers the opportunity to purchase on a credit basis. As an example, a furniture store sells a bedroom set worth $6,000 to a newlywed couple. The couple puts down $2,500 to fix the sale and then signs a contract to pay the remaining $3,500 within the next year. That $3,500 would be listed as accounts receivable for the furniture firm.
Prepaid expense is an accrual accounting term that represents a payment that is made in advance of their actual occurrence. Insurance would be an example of a prepaid expense because a company is paying premiums to cover damages that might occur in the near future. If a year’s worth of rent were paid at one time, it too would be viewed as a prepaid expense.
Inventory is the tangible goods held by a business for the production of goods and services. Inventory can fall into three categories: raw materials, work-in-process (WIP), and finished goods. Raw materials inventory represents items or commodities purchased by a firm to create products and services. WIP inventory represents “partially completed goods, part or subassemblies that are no longer part of the raw materials inventory and not yet finished goods.”[14] The valuation of WIP should include the cost of direct material, direct labor, and overhead put into the WIP inventory. Finished inventory represents products that are ready for sale. Generally accepted accounting principles (GAAP) require that a business value its inventory on either the cost price or the market price—whichever is lowest. This inherent conservative approach to valuation is due to the desire to prevent the overestimation of inventory during inflationary periods.
Total current assets are the summation of the aforementioned items and are defined as follows:
total current assets = cash + marketable securities + accounts receivable + prepaid expenses + inventory.
The next set of items in the asset section of the balance sheet is long-term assets. Long-term assets are those assets that will not be turned into cash within the next year. Long-term assets may include a category known as investments. These are items that management holds for investment purposes, and they do not intend to “cash in” within the upcoming year. They might consist of other companies’ stock, notes, or bonds. In some cases, they may represent specialized forms—money put away for pension funds. The next major category of long-term assets is fixed assets. Fixed assets include plant, equipment, and land. Generally, these are valued at their original cost. The value of these assets will decline over time. As an example, you purchase a new car for $25,000. If you were to sell the same car one, two, or five years later, its value would be less than the original purchase price. This recognition is known as depreciation, which is a noncash expense that specifically recognizes that assets decline in value over time. Accumulated depreciation is a running total of all depreciation on assets. Depreciation is also found on the income statement. Its presence in that financial statement enables a business to reduce its taxable income. There are many methods by which you can compute the depreciation value on fixed assets. These methods can be split into two broad categories: straight-line depreciation and accelerated depreciation. Straight-line depreciation is fairly easy to illustrate. In the example of the car, assume you purchased this car for company use. You intend to use it for five years, and at the end of the five years, you plan on scrapping the car and expect that its salvage value will be zero.
Depreciation Calculations
| Year 0 | Year 1 | Year 2 | Year 3 | Year 4 | Year 5 | |
|---|---|---|---|---|---|---|
| Depreciation | $0 | $5,000 | $5,000 | $5,000 | $5,000 | $5,000 |
| Accumulated depreciation | $0 | $5,000 | $10,000 | $15,000 | $20,000 | $25,000 |
| Net asset value | $25,000 | $20,000 | $15,000 | $10,000 | $5,000 | $0 |
Because the useful lifetime of the vehicle was five years, the original value of the vehicle was divided by five; therefore, the annual depreciation would equal $5,000 ($25,000/5 = $5,000 per year). The accumulated depreciation simply sums up the prior years’ depreciation for that particular asset.
Accelerated depreciation methods attempt to recapture a major portion of the depreciation earlier in the life of an asset. Accelerated depreciation yields tax-saving benefits earlier in the life of any particular fixed asset. The appropriate method of depreciating an asset for tax purposes is dictated by the Internal Revenue Service (IRS). One should look at the IRS publication 946—How to Depreciate Property—to get a better understanding of the concept of depreciation and how to properly compute it.
The last category of long-term assets is intangible assets—assets that provide economic value to a business but do not have a tangible, physical presence. Intangible assets include items such as patents, franchises, copyrights, and goodwill. Thus the value of long-term assets can be calculated as follows:
long-term assets = investments + fixed assets − accumulated depreciation + intangible assets.
The last element on the asset side of the balance sheet is the total assets. This is the summation of current assets and long-term assets.
On the other side of the balance sheet, we have liabilities plus owner’s equity. The elements of liabilities consist of current liabilities and long-term liabilities. These represent what a business owes to others. Current liabilities are debts and obligations that are to be paid within a year. These include notes payable, accounts payable, other items payable (e.g., taxes, wages, and rents), dividends payable, and the current portion of long-term debt. In equation form,
current liabilities = notes payable + accounts payable + other items payable + dividends payable + the current portion of long-term debt.
Notes payable represents money that is owed and which must be repaid within a year. It is fairly inclusive because it may include lines of credit from banks that have been used, short-term bank loans, mortgage obligations, or payments on specific assets that are due within a year.
Accounts payable are short-term obligations that a business owes to suppliers, vendors, and other creditors. It may consist of all the supplies and materials that were purchased on credit.
Other items payable can include items such as the payroll and tax withholdings owed to employees or the government but which have not as of yet been paid.
Dividends payable is a term that is appropriate for businesses structured as corporations. This category represents the amount that a business plans to pay its shareholders.
The current portion of long-term debt represents how much of the long-term debt must be repaid within the upcoming fiscal year. This would include the portion of the principal that is due in this fiscal year.
The other portion of liabilities is represented by long-term liabilities. These are debts payable over a period greater than one year and include long-term debt, pension fund liability, and long-term lease obligations. In equation form,
long-term liabilities = long-term debt + pension fund liabilities + long-term lease obligations.
Total liabilities is the sum of current liabilities and long-term liabilities.
The other major component of the right-side of the balance sheet is owner’s (or stockholders’) equity. Owner’s equity represents the value of the shareholders’ ownership in a business. It is sometimes referred to as net worth. It may be composed of items such as paid in capital and retained earnings. Paid in capital is the amount of money provided by investors through the issuance of common or preferred stock.[15] Retained earnings is the cumulative net income that has been reinvested in a business and which has not been paid out to shareholders as dividends.[16]
The Balance Sheet
Below you can see six years’ worth of balance sheet statements for a hypothetical small business—Acme Enterprises. It is obviously important to have such information, but what exactly might this tell us in terms of the overall success and operation of the business? We will return to these statements later in this chapter to show how those questions can be addressed with ratio analysis.
Acme Enterprises’ Balance Sheet, 2005–2010 ($ Thousands)
| December 31 | ||||||
|---|---|---|---|---|---|---|
| Assets | 2005 | 2006 | 2007 | 2008 | 2009 | 2010 |
| Cash and marketable securities | $30.0 | $32.3 | $34.7 | $37.3 | $40.1 | $43.1 |
| Accounts receivable | $100.0 | $107.5 | $115.6 | $124.2 | $133.5 | $143.6 |
| Inventories | $70.0 | $75.3 | $80.9 | $87.0 | $93.5 | $100.5 |
| Other current assets | $90.0 | $96.8 | $104.0 | $111.8 | $120.2 | $129.2 |
| Total current assets | $290.0 | $311.8 | $335.1 | $360.3 | $387.3 | $416.3 |
| Property, plant, and equipment—gross | $950.0 | $1,154.5 | $1,387.2 | $1,654.6 | $1,958.1 | $2,306.2 |
| Accumulated depreciation | $600.0 | $695.0 | $810.5 | $949.2 | $1,114.6 | $1,310.4 |
| Property, plant, and equipment—net | $350.0 | $459.5 | $576.7 | $705.4 | $843.5 | $995.7 |
| Other noncurrent assets | $160.0 | $176.0 | $193.6 | $213.0 | $234.3 | $257.7 |
| Total assets | $800.0 | $947.3 | $1,105.5 | $1,278.6 | $1,465.1 | $1,669.7 |
| Liabilities | ||||||
| Accounts payable | $91.0 | $97.8 | $105.2 | $113.0 | $121.5 | $130.6 |
| Short-term debt | $150.0 | $177.5 | $216.3 | $264.2 | $328.1 | $406.0 |
| Other current liabilities | $110.0 | $118.3 | $127.1 | $136.7 | $146.9 | $157.9 |
| Total current liabilities | $351.0 | $393.6 | $448.6 | $513.9 | $596.5 | $694.6 |
| Long-term debt | $211.0 | $211.0 | $211.0 | $211.0 | $211.0 | $211.0 |
| Deferred income taxes | $50.0 | $53.8 | $57.8 | $62.1 | $66.8 | $71.8 |
| Other noncurrent liabilities | $76.0 | $81.7 | $87.8 | $94.4 | $101.5 | $109.1 |
| Total liabilities | $688.0 | $740.0 | $805.2 | $881.4 | $975.8 | $1,086.5 |
| Paid in capital | $— | $— | $— | $— | $— | $— |
| Retained earnings | $112.0 | $207.3 | $300.3 | $397.2 | $489.3 | $583.3 |
| Total owner’s equity | $112.0 | $207.3 | $300.3 | $397.2 | $489.3 | $583.3 |
| Total liabilities + owner’s equity | $800.0 | $947.3 | $1,105.5 | $1,278.6 | $1,465.1 | $1,669.7 |
The Income Statement
Whereas the balance sheet looks at a firm at a particular point (date) in time, the income statement examines the overall profitability of a firm over a particular length or period of time. Normally, there are several time periods that may be used: fiscal year, fiscal quarter, or monthly. The income statement is also known as a profit and loss statement. It identifies all sources of revenues generated by a business and all the expenses incurred. The income statement provides the best insight into whether a business is profitable.
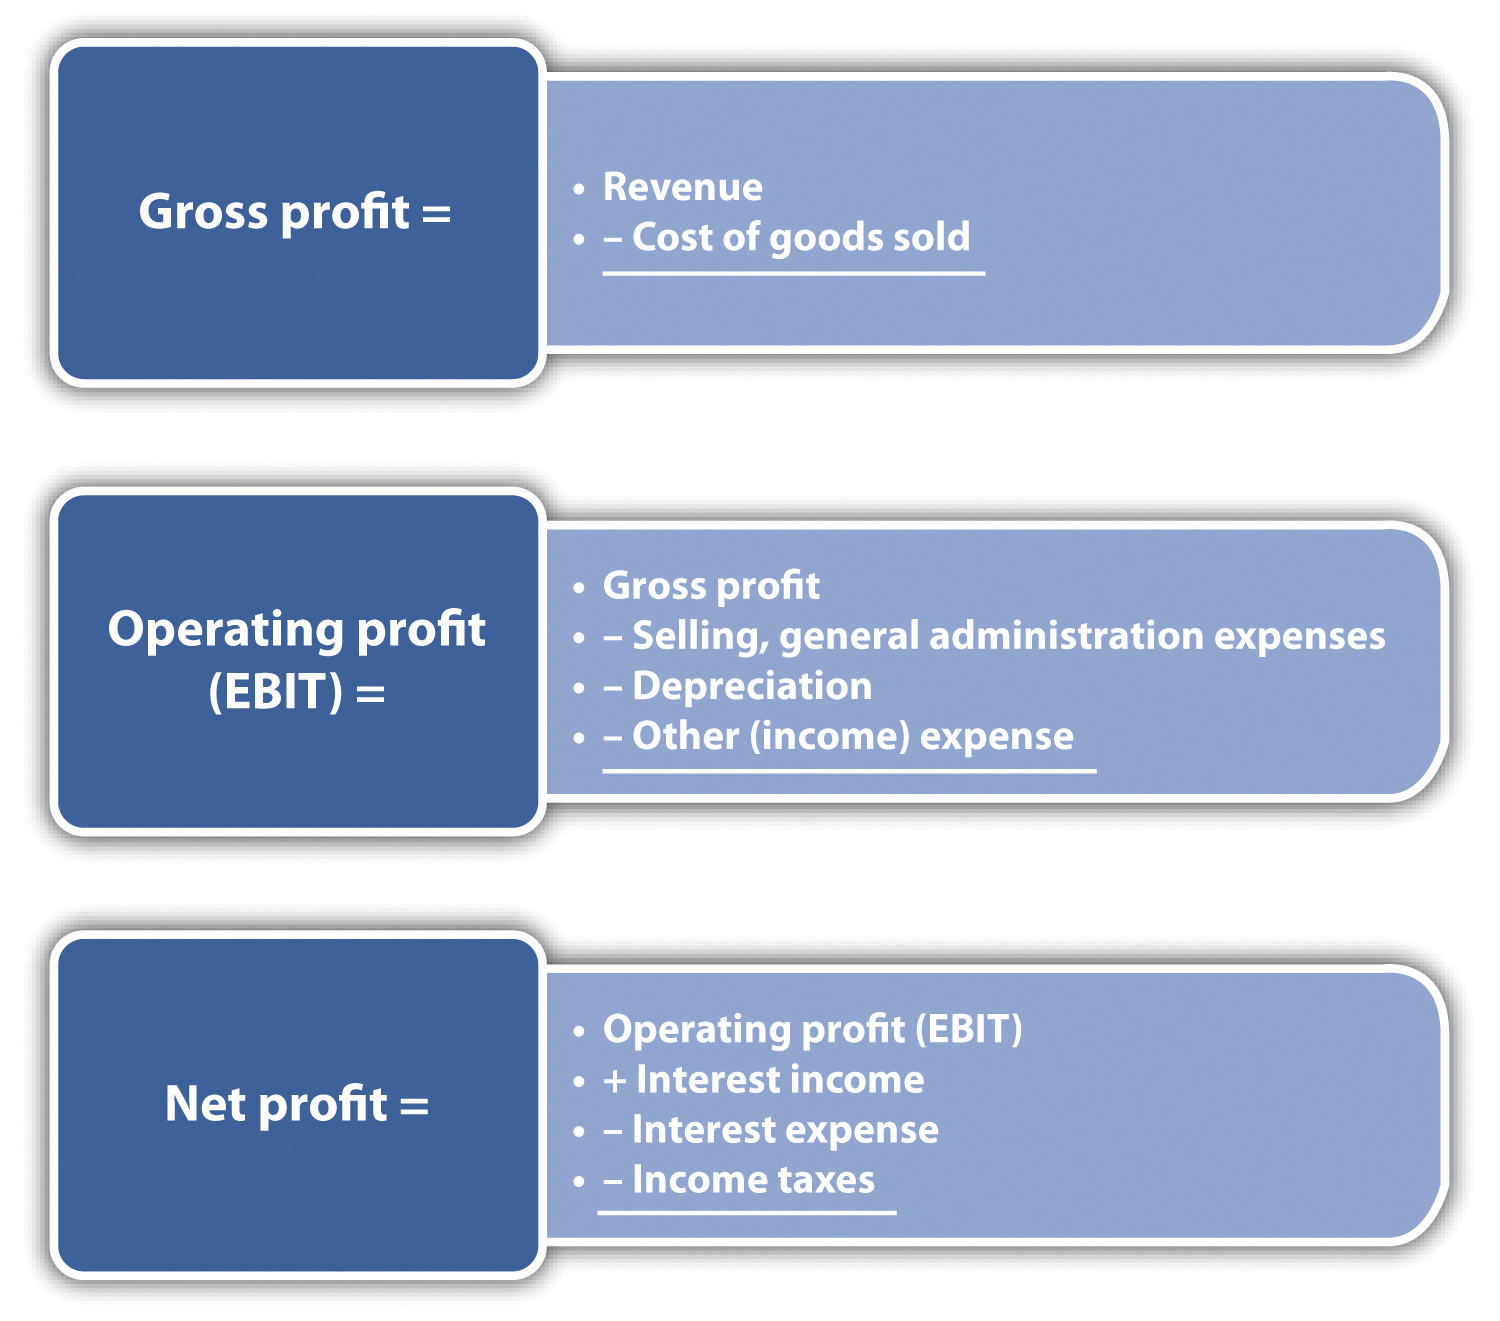
The income statement begins by identifying the sales or income for the designated period of time. Sales would be all the revenues derived from all the products and services sold during that time. The term income is sometimes used and represents all revenues and additional incomes produced by a business during the designated period. The next item in the income statement is the cost of goods sold (COGS), which is composed of all costs associated with the direct production of goods and services that were sold during the time period. It would include the costs of the raw materials used to produce the goods and those costs associated with production, such as direct labor. With these two values, the first measure of profit—gross profit—can be calculated:
gross profit = income − COGS.
The next element in the income statement is operating expenses—expenses that are incurred during the normal operation of a business. Operating expenses can be broken down into four broad categories: selling expenses, general and administrative expenses, depreciation, and other overhead expenses. Selling expenses would include all salaries and commissions paid to the business’s sales staff. It would also include the cost of promotions, advertising expenses, and other sales expenditures. Promotion costs might consist of costs associated with samples or giveaways. Advertising expenses would include all expenditures for print, radio, television, or Internet ads. Other sales expenditures would include money spent on meals, travel, meetings, or presentations by the sales staff. General and administrative expenses are those associated with the operation of a business beyond COGS and direct-selling expenses. Expenditures in this category would include salaries of office personnel, rent, and utilities. Depreciation was covered in the previous subsection. The balance sheet has a component designated accumulated depreciation. This is the summation of several years’ worth of depreciation on assets. In the income statement, depreciation is the value for a particular time period. If you look back at our depreciation calculations table, the annual depreciation on the vehicle was $5,000. If a business was developing an income statement for one particular year, then the depreciation would be listed as $5,000. It is a noncash expenditure expense. The last component of operating expenses would be other overhead costs—a fairly generic category that may include items such as office supplies, insurance, or a variety of services a business might use. Having identified all the components of operating expenses, one is now in a position to compute a second measure of profitability—operating profit, which is sometimes referred to as earnings before interest and taxes (EBIT):
operating profit (EBIT) = gross profit − operating expenses.
The next section of the income statement is designated other revenues and expenses. This segment would include other nonoperational revenues (such as interest on cash or investments) and interest payments on loans and other debt instruments. When the other revenues and expenses are subtracted from the operating profit, one is left with earnings before taxes (EBT):
EBT = operating profit − other revenues and expenses.
Taxes are then computed on the EBT and then subtracted. This includes all federal, state, and local tax payments that a business is obligated to pay. This brings us to our last measure of profitability—net profit:
net profit = EBT − taxes.
If a business does not pay out dividends, the net profit becomes an addition to retained earnings. The format of the income statement is summarized below. The income statement is the item that most individuals look at to determine the success of business operations.
The Income Statement
Acme Enterprises’ Income Statement, 2005–10 ($ Thousands)
| 2005 | 2006 | 2007 | 2008 | 2009 | 2010 | |
|---|---|---|---|---|---|---|
| Sales | $1,000.0 | $1,075.0 | $1,155.6 | $1,242.3 | $1,335.5 | $1,435.6 |
| COGS | $500.0 | $537.5 | $566.3 | $608.7 | $641.0 | $689.1 |
| Gross operating profit | $500.0 | $537.5 | $589.4 | $633.6 | $694.4 | $746.5 |
| Selling and general administrative expenses | $250.0 | $268.8 | $288.9 | $310.6 | $333.9 | $358.9 |
| Depreciation | $95.0 | $115.5 | $138.7 | $165.5 | $195.8 | $230.6 |
| Other net (income)/expenses | $0.0 | $0.0 | $0.0 | $0.0 | $0.0 | $0.0 |
| EBIT | $155.0 | $153.3 | $161.7 | $157.5 | $164.8 | $157.0 |
| Interest income | $2.1 | $2.3 | $2.4 | $2.6 | $2.8 | $3.0 |
| Interest expense | $10.5 | $12.4 | $15.1 | $18.5 | $23.0 | $28.4 |
| Pretax income | $146.6 | $143.1 | $149.0 | $141.7 | $144.6 | $131.6 |
| Income taxes | $51.31 | $50.10 | $52.16 | $49.58 | $50.61 | $46.06 |
| Net income | $95.29 | $93.04 | $96.87 | $92.08 | $93.99 | $85.54 |
| Dividends | $— | $— | $— | $— | $— | $— |
| Addition to retained earnings | $95.29 | $93.04 | $96.87 | $92.08 | $93.99 | $85.54 |
The Cash-Flow Statement
Customer satisfaction, employee satisfaction and cash flow the three most important indicators for business.Jack Welch, “A Healthy Company?,” Business Week, May 3, 2006.
Jack Welch
The third component of financial statements is the cash-flow statement. There are two types of cash-flow statements—one examines cash flows for a given period (historic), and the other is a projection of future cash flows. The historic cash-flow statement is similar to the income statement in that it looks at cash inflows and cash outflows for a business during a specified period of time. Like the income statement, these periods of time can be the fiscal year, the fiscal quarter, or a month. The cash-flow projections statement attempts to identify cash flows into a firm and cash flows from a firm for some future period. This projection is extremely important because it may identify future subperiods in which a firm is producing a negative cash flow—where cash outflows exceed cash inflows.
From the standpoint of a small business owner, cash-flow statements provide insight into where cash flows are coming and going. The cash-flow projections statement may be the most important component of all the financial statements. Its importance stems from the fact that the flow of cash into a firm may not be synchronized with its cash outflows. Should there be a significant mismatch with cash outflows being significantly higher than cash inflows, a business may be in great difficulty with respect to meeting its current obligations, such as payroll, paying suppliers, and meeting short-term creditors. As we will see, cash-flow projection statements require several forecasts. These are discussed later in this section.
At some point, many businesses will experience negative cash flow. In fact, a negative cash flow is quite common in start-up operations and high-growth businesses where there is a pressing need for capital expenditures, research and development expenditures, and other significant cash outflows. One can also see the recurring presence of negative cash flows in businesses with seasonal sales. Negative cash flows can be covered by short-term borrowing. However, this type of borrowing brings up two important issues. First, any type of borrowing raises the overall debt level of a business, which might have an impact on the interest rate on the debt. Second, when a negative cash flow exists either because of an unforeseen exigency or because a business owner has failed to properly conduct a cash-flow projection analysis, a lender might look at a business in a jaundiced manner, which could have long-term consequences for a business.
A careful examination of the cash-flow statement could illustrate a point that has been mentioned several times in this book: there can be a significant difference between positive cash flow and profit. In looking at the income statement, one could find a positive net income (profit) and then examine the cash-flow statement and discover that a business has a significant negative cash flow. The cash-flow statement specifically maps out where cash is flowing into a firm and where it flows out. A properly developed cash-flow statement will show if a business will be generating enough cash to continue operations, whether it has sufficient cash for new investments, and whether it can pay its obligations. As previously stated, many of the uninitiated will look singularly at profits, while those who have greater expertise in business will always believe that cash is king.
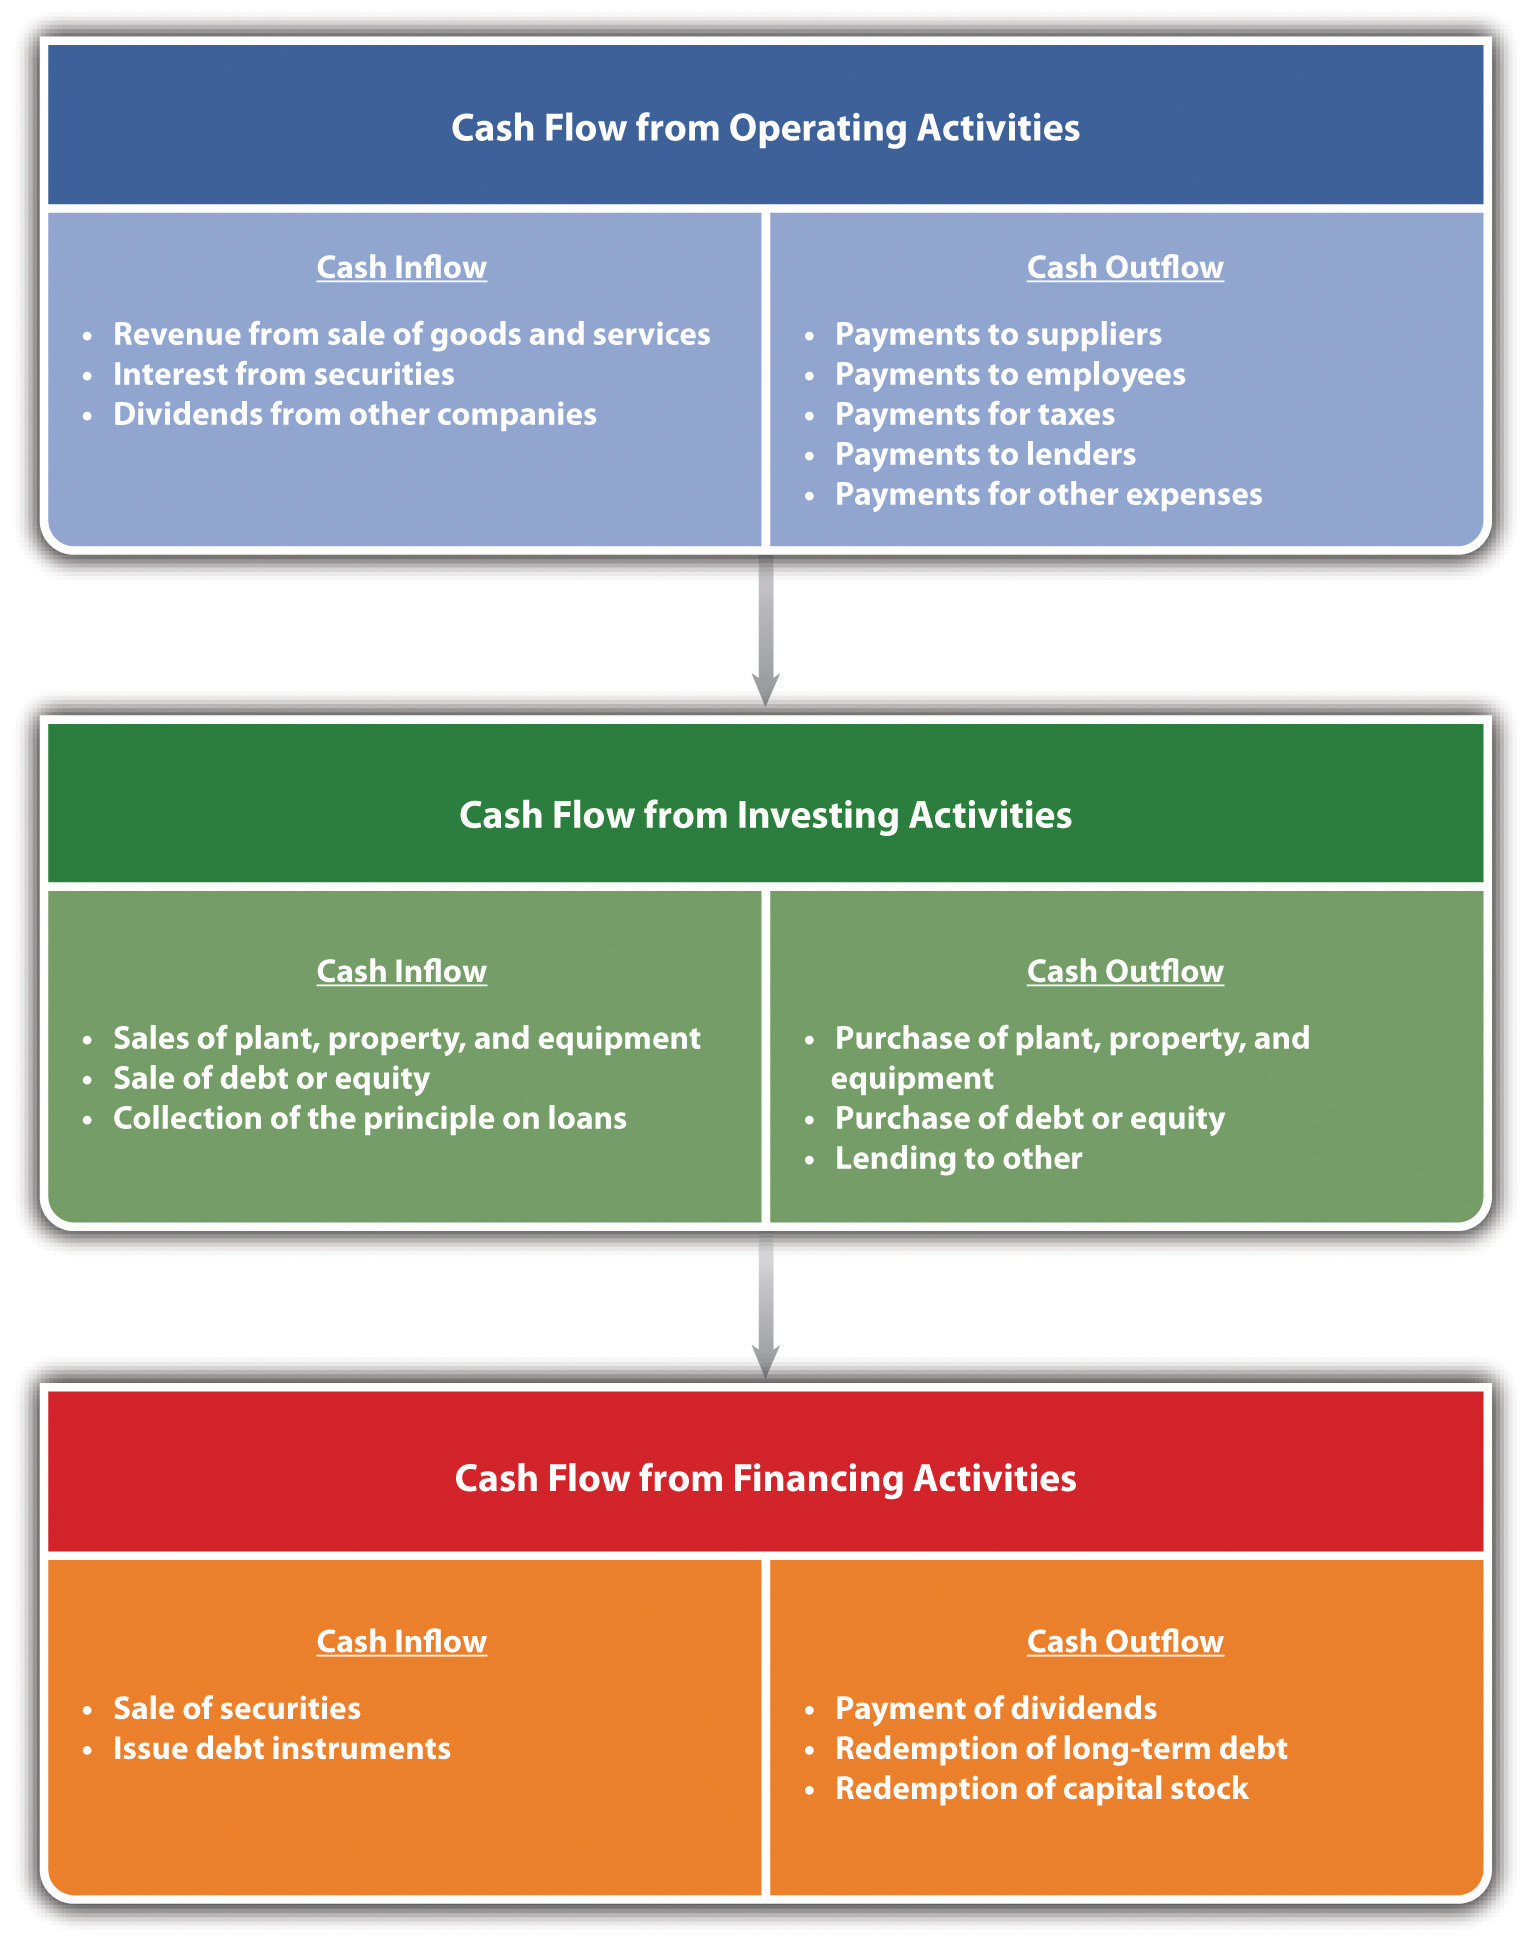
As a way of visualization, the cash-flow statement bears some similarity to the bank statement you may receive at the end of the month. A bank statement shows the beginning cash balance, deposits (cash inflows), and checks you have written (cash outflows) for that month. Hopefully, you have a positive cash flow—cash inflows are greater than cash outflows—and you have not bounced any checks. Unlike the bank statement, the cash-flow statement is broken into three major categories: operations, financing, and investing. Cash flow from operations examines the cash inflows from all revenues, plus interest and dividend payments from investments held by a business. It then identifies the cash outflows for paying suppliers, employees, taxes, and other expenses. Cash flow from investing examines the impact of selling or acquiring current and fixed assets. Cash flow from financing examines the impact on the cash position from the changes in the number of shares and changes in the short and long-term debt position of a firm.
Cash inflows from operating activities consist of the following:
- Cash derived from the sale of goods or services
- Cash derived from accounts receivable
- Any cash derived from interest or dividends
- Any other cash derived that is not identified with financing or investments
The cash outflows from operating activities consist of the following:
- Cash outlays for goods purchased in the creation of goods and services
- Cash outlays for payment to suppliers
- Cash outlays to employees
- Cash paid for taxes or interest paid to creditors
Financing focuses on the cash flows associated with debt or equity. Some of the cash inflows associated with financing activities consist of the following:
- Cash from the sale of a company’s stock
- Cash received from borrowing (debt)
Cash outflows associated with financing consist of the following:
- Cash outlays to repay principal on long- and short-term debt
- Cash outlays to repurchase preferred stocks
- Cash outlays to pay for dividends on either common or preferred stock
The third category is investing. The sources of cash flow from investing activities consist of the following:
- Cash received from the sale of assets
- Cash received from the sale of equity investments
- Cash received from collections on a debt instrument
Cash outflows associated with investing activities consist of the following:
- Cash outlays to acquire a debt instrument of another business
- Cash payments to buy equity interest in other businesses
- Cash outlays to purchase a productive asset
A schematic of the cash-flow statement’s three areas of analysis is presented in the table below:
Cash Flow Breakdown
Cash-flow projection statements are about the state of future cash flows, which means they require forecasts. This translates into multiple forecasts—sales forecasts, forecasts of expenses, forecasts for necessary investments, and forecasts for a business’s financing requirements. The importance of forecasts for planning is discussed in Chapter 5.
The most common approach for cash-flow forecasting in small businesses centers on projections of cash receipts and disbursements. These projections are often based on recent past data. We will demonstrate—shortly—this approach through an extensive example. This approach is generally limited to short and midterm forecasts (i.e., three to twelve months). There are other approaches to cash-flow forecasting; however, given the relative complexity of these approaches, they are often used only by larger and more sophisticated businesses. These other approaches include the adjusted net income method, the pro forma balance sheet method, and the accrual reversal method.[17]
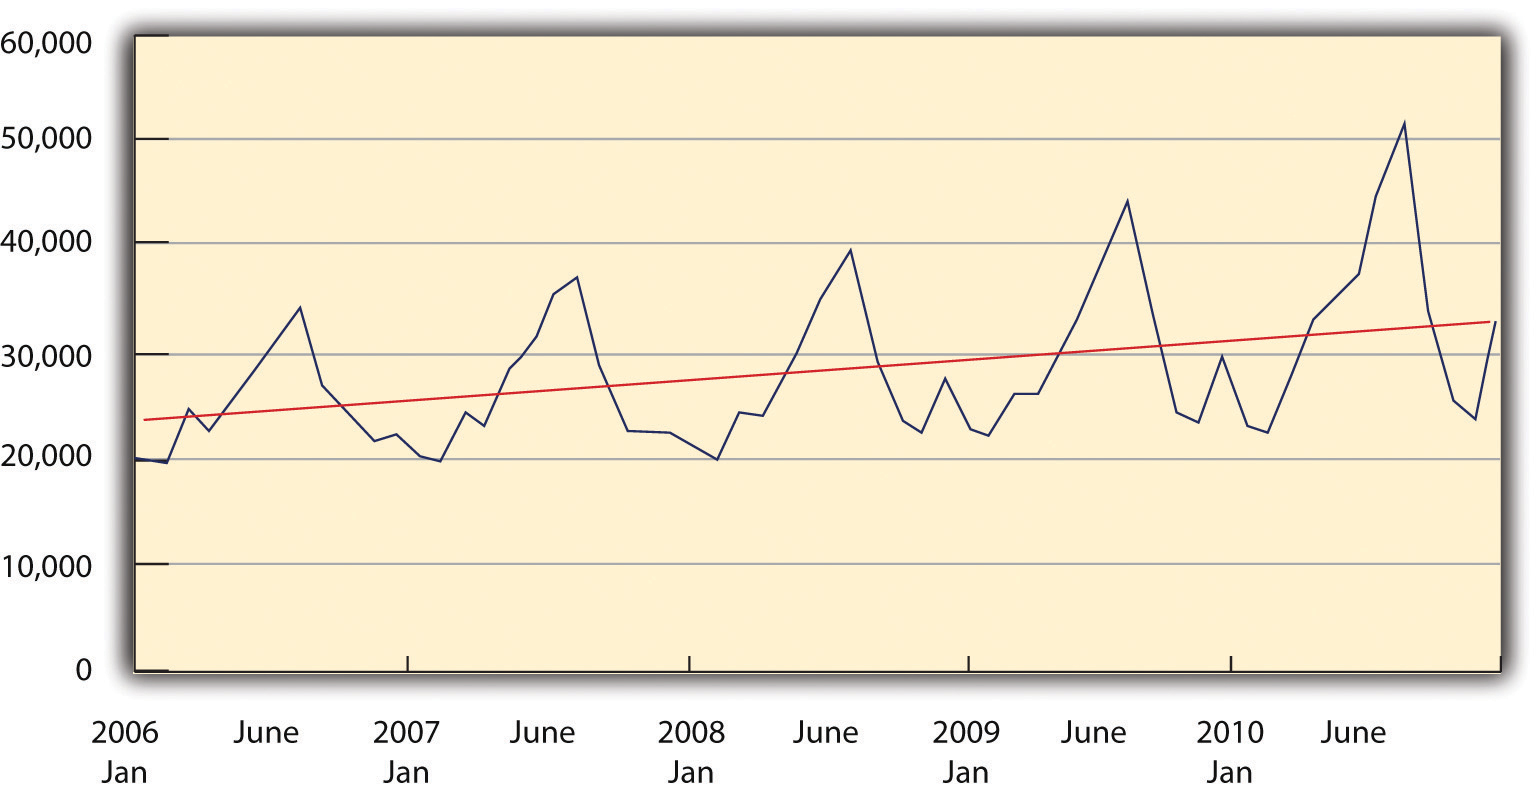
The concept of cash-flow projection forecasting can be illustrated by using an example. Alex McLellan runs Soft Serve Services—a business that repairs and services soft-serve ice cream machines. His clients include ice cream parlors, resorts, and outlets at malls. Alex is a former engineer and somewhat methodical in developing his calculations for future budgets. He will be operating on the assumption that his business will be limited to his current locale. Alex has followed the same pattern for forecasting cash flows for years. First, he gathers together from his records his monthly and annual sales for the last five years, which are provided in the table below.
Sales Data for Soft Serve Services
| 2006 | 2007 | 2008 | 2009 | 2010 | |
|---|---|---|---|---|---|
| January | $20,135 | $20,562 | $21,131 | $22,657 | $23,602 |
| February | $19,545 | $19,739 | $19,852 | $22,154 | $22,307 |
| March | $24,451 | $24,360 | $24,594 | $26,361 | $27,590 |
| April | $22,789 | $23,374 | $24,000 | $26,220 | $32,968 |
| May | $25,986 | $28,531 | $27,099 | $30,057 | $34,834 |
| June | $28,357 | $30,468 | $32,893 | $34,168 | $37,078 |
| July | $32,650 | $35,307 | $36,830 | $40,321 | $46,899 |
| August | $34,488 | $37,480 | $40,202 | $44,890 | $52,042 |
| September | $26,356 | $27,909 | $29,317 | $32,917 | $33,309 |
| October | $24,211 | $22,795 | $23,719 | $24,339 | $25,691 |
| November | $21,722 | $22,272 | $22,147 | $23,080 | $23,466 |
| December | $22,017 | $22,454 | $28,321 | $30,468 | $33,583 |
| Annual sales | $302,706 | $315,252 | $330,105 | $357,631 | $393,368 |
Using these data, Alex was able to calculate the growth rate in sales for the last four of the five years. As an example:
growth rate 2007 = (sales 2007 − sales 2006) / (sales 2006) = ($315,252 − $302,706) / ($302,706) = ($12,546) / ($302,706) = 4.14 percent.
Although the average of the four annual growth rates was 6.8 percent (the annual growth rates were 4.14 percent in 2007, 4.71 percent in 2008, 8.34 percent in 2009, and 9.99 percent in 2010, thus having an average of 6.8 percent), Alex believes that the last two years were unusually good, and the growth rate for 2011 would be slightly lower at a rate of 6.5 percent. This rate of growth would mean that his estimate for sales in 2011 would be $418,937, which comes from the following:
annual sales 2011 = annual sales 2010 × (1 + growth rate 2011) = $393,368 × (1.065).
He knows from experience that his sales are quite seasonal, as illustrated below. Alex believes that there is a high degree of consistency in this seasonality of sales across the years. So he computes (using a spreadsheet program) what percentage of annual sales occurs in each month. This calculation for January 2006 would be given as follows:
percentage of annual sales for January 2006 = (January 2006 sales) / (annual sales 2006) = ($20,135) / ($302,706) = 6.65 percent.
Seasonality in Sales
This table shows the analysis for each month in each of the five years and the averages for each month:
Monthly Sales as a Percentage of Annual Sales
| 2006 (%) | 2007 (%) | 2008 (%) | 2009 (%) | 2010 (%) | Average (%) | |
|---|---|---|---|---|---|---|
| January | 6.65 | 6.52 | 6.40 | 6.34 | 6.00 | 6.38 |
| February | 6.46 | 6.26 | 6.01 | 6.19 | 5.67 | 6.12 |
| March | 8.08 | 7.73 | 7.45 | 7.37 | 7.01 | 7.53 |
| April | 7.53 | 7.41 | 7.27 | 7.33 | 8.38 | 7.59 |
| May | 8.58 | 9.05 | 8.21 | 8.40 | 8.86 | 8.62 |
| June | 9.37 | 9.66 | 9.96 | 9.55 | 9.43 | 9.60 |
| July | 10.79 | 11.20 | 11.16 | 11.27 | 11.92 | 11.27 |
| August | 11.39 | 11.89 | 12.18 | 12.55 | 13.23 | 12.25 |
| September | 8.71 | 8.85 | 8.88 | 9.20 | 8.47 | 8.82 |
| October | 8.00 | 7.23 | 7.19 | 6.81 | 6.53 | 7.15 |
| November | 7.18 | 7.06 | 6.71 | 6.45 | 5.97 | 6.67 |
| December | 7.27 | 7.12 | 8.58 | 8.52 | 8.54 | 8.01 |
Alex was able to estimate sales for January 2011 in the following manner: because Alex was using spreadsheet software, the monthly averages were computed out to more than two decimal places. This explains why the calculations are not exact. As in the case of January, the actual monthly percentage was closer to 6.3821 percent, which provides the monthly forecast of $26,737.
January 2011 sales = annual sales 2011 × January percentage = ($418,937) × (6.38 percent) = $26,737.
Using the same approach, he was able to compute forecasted sales for February and March. To maintain sales, Alex offers his customers a rather generous credit policy. He asks them to pay 50 percent of the bill in the month in which the work is done; another 35 percent of the bill in the following month, and the remaining 15 percent of the bill two months after the work has been completed. For Alex to project cash inflows for January, he would need to consider sales from the two prior months—December and November. His projected cash inflows for January would be determined as follows: (These calculations have been rounded to the nearest dollar.)
November 2010 sales = $23,466 December 2010 sales = $33,583 January 2011 sales = $26,737 cash inflow from November 2010 sales = ($23,466) × 15 percent = $3,520 cash inflow from December 2010 sales = ($33,583) × 35 percent = $11,754 cash inflow from January 2011 sales = ($26,737) × 50 percent = $13,368 total cash inflows from operations = sum of cash inflows for three months = $28,642.
Alex then estimates his cash outflows from operations. From past experience, he knows that the purchases of parts and materials run approximately 50 percent of the dollar value of his sales. However, because of delays in acquiring parts and materials, he must order them in advance. He has to anticipate what sales would be the following month and has to place a purchase order predicated on that value. Further, 60 percent of that dollar value is in that month and the remaining 40 percent is in the following month. This can be illustrated for January 2011. To determine the purchases of parts and materials in January, he begins with his forecast for sales in February 2011.
February 2011 sales = $25,637 parts and materials purchases in January 2011 = 50 percent of February 2011 sales = 50 percent × $25,637 = $12,819.
He is obligated to pay 60 percent of this amount in January 2011 and the remaining 40 percent in February 2011. This also means that his cash outlay in January 2011 must include a payment for 40 percent of December’s purchases.
parts and materials purchases in December 2011 = 50 percent of January 2011 sales = 50 percent × $26,737 = $13,369 parts and materials cash outlay in January 2011 = 60 percent of purchases January 2011 + 40 percent of purchases December 2010 parts and materials cash outlay in January 2011 = (60 percent × $12,819) + (40 percent × $13,369) = $13,038.
In addition to purchasing parts and materials, Alex has to consider his operational expenses, which include wages, payroll taxes, office supplies, repairs, advertising, and expenses related to automobiles, phone bills, rent, utilities, expenses associated with accounting services, and taxes. These are itemized in the table below. Adding in these expenses brings his total cash outflow $19,864.
For January 2001, he has no cash inflows or cash outflows with respect to either investment activities or financing activities. This means that his total cash flow for January 2011 represents the difference between cash inflows and outflows for operational activities. His cash flow for January 2011 was a positive value of $8,778. Because he ended December 2010 with a cash position of $3,177, the addition of this $8,778 brings his cash position at the end of January 2011 to $11,955. His bank, with which he has an open line of credit, requires that he maintain a minimum of $2,500 in his cash account each month. Should Alex drop below this amount, his bank will lend him—automatically—up to $5,000.
It is useful to examine the rest of his projections. February 2011 follows much as January 2011. Alex was able to produce a positive net cash flow in February of $5,669, which brought his ending cash position at the end of February 2011 to $17,624.
Unlike the other months of 2011, Alex planned on producing cash flows with respect to investment activities in March 2011. He planned on selling an asset to a friend and anticipated a positive cash flow of $500 from this sale. He also planned on purchasing a used van in March 2011 and estimated that the price would be $21,000. His intention was to pay for the van from his cash account and not take out a car loan. His cash outflows for March 2011 were a negative $16,075. With the bank’s requirement of maintaining a $2,500 minimum balance, this meant that Alex activated the automatic borrowing option from his bank to the amount of $950. It required some effort on Alex’s part to build the cash-flow spreadsheet, but it enabled him to examine various options, such as the impact of deferring the purchase of the van until May 2011. Although any cash-flow spreadsheet is dependent on the accuracy of forecasts, it is a mechanism by which a small business owner can examine various scenarios and determine the possible impact of those scenarios on his or her overall cash flow.
Cash-Flow Projections for the First Quarter of 2011
| November | December | January | February | March | |
|---|---|---|---|---|---|
| Cash Flow from Operating Activities | |||||
| Cash on hand at end of month | $3,177 | $11,955 | $17,624 | $1,550 | |
| Cash Inflow from Operations | |||||
| Sales | $23,466 | $33,583 | $26,737 | $25,637 | $31,537 |
| Cash flow from month of sales | $13,369 | $12,818 | $15,769 | ||
| Cash flow from prior month’s sales | $11,754 | $9,358 | $8,973 | ||
| Cash flow from two month’s prior sales | $3,520 | $5,037 | $4,011 | ||
| Total cash inflow from operations | $28,642 | $27,214 | $28,752 | ||
| Parts Purchases | |||||
| Cash outflow for this month’s purchases | $7,691 | $9,461 | $9,533 | ||
| Cash outflow for prior month’s purchases | $5,347 | $5,127 | $6,307 | ||
| Gross wages (excludes withdrawals) | $4,000 | $4,000 | $4,000 | ||
| Payroll expenses (taxes, etc.) | $150 | $150 | $150 | ||
| Outside services | $— | $— | $— | ||
| Supplies (office and operating) | $50 | $50 | $50 | ||
| Repairs and maintenance | $— | $— | $450 | ||
| Advertising | $100 | $200 | $250 | ||
| Auto, delivery, and travel | $120 | $150 | $180 | ||
| Accounting and legal | $200 | $200 | $200 | ||
| Rent | $1,650 | $1,650 | $1,650 | ||
| Telephone | $65 | $65 | $65 | ||
| Utilities | $325 | $325 | $325 | ||
| Insurance | $166 | $166 | $166 | ||
| Taxes (real estate, etc.) | $— | $— | $1,000 | ||
| Interest | $— | ||||
| Other expenses | $— | $— | $— | ||
| Total cash outflows from operations | $19,864 | $21,544 | $24,327 | ||
| Sale of asset | $— | $— | $500 | ||
| Sale of debt or equity | $— | $— | $— | ||
| Collection of principal on a loan | $— | $— | $— | ||
| Total cash flow from investing activities | $— | $— | $500 | ||
| Purchase of plant, property, and equipment | $— | $— | $21,000 | ||
| Purchase of debt | $— | $— | $— | ||
| Total cash outflows from investing | $— | $— | $21,000 | ||
| Sales of securities or equity | $— | $— | $— | ||
| Issue of debt instruments | $— | $— | $— | ||
| Total cash inflow from financing activities | $— | $— | $— | ||
| Payment of dividends | $— | $— | $— | ||
| Redemption of long-term debt | $— | $— | $— | ||
| Total cash outflows from financing | $— | $— | $— | ||
| Net cash flow | $8,778 | $5,669 | $(16,075) | ||
| Required cash balance | $2,500 | $2,500 | $2,500 | $2,500 | $2,500 |
| Required borrowing | $— | $— | $(950) |
Key Takeaways
- To truly understand how well a business is doing requires an ability to understand the financial statements of the business.
- The balance sheet shows what a business owns and what claims are on the business.
- The income statement shows how profitable a business is and identifies the expenses of the business.
- Cash flow is the lifeblood of a business’s operation.
- Cash-flow projections are vital for any business.
Financial Ratio Analysis
One can say that figures lie. But figures, when used in financial arguments, seem to have the bad habit of expressing a small part of the truth forcibly, and neglecting the other, as do some people we know. -Fred Schwed[18]
We previously discussed the differences between managerial accounting and financial accounting. Managerial accounting focuses on providing information that is useful for the managers of a firm. Financial accounting provides information to interested external constituencies. Both use information derived from financial statements. These numbers, however, may not provide a singular insight into the overall economic effectiveness of any particular business. These numbers must be placed in some form of context. As an example, suppose you are told that a particular business earned $2 million worth of profit last year. Obviously, earning a $2 million profit is better than a $1 million profit and certainly better than a $2 million loss. However, you are still left with the question of exactly how good that $2 million profit is. After all, if you were told that Walmart made only $2 million profit last year, you would likely be concerned with respect to the management capability and performance of Walmart. Making only $2 million profit on revenues in excess of $400 billion worth of sales would not be at all impressive. However, if you were told that a mom-and-pop grocery store made $2 million profit last year based on $4 million of sales, you would be amazed at that mom-and-pop store and hold them in considerable esteem for their management capability.
One way of putting financial data into a comparative context is known as financial ratio analysis. From a financial accounting standpoint, ratio analysis enables external constituencies to evaluate the performance of a firm with respect to other firms in that particular industry. This is sometimes referred to as comparative ratio analysis. From a managerial accounting standpoint, ratio analysis can assist a management team to identify areas that might be of concern. The management team can track the performance on these ratios across time to determine whether the indicators are improving or declining. This is referred to as trend ratio analysis. There are literally scores of financial ratios that can be calculated to evaluate a firm’s performance.
Financial ratios can be grouped into five categories: liquidity ratios, financial leverage ratios, asset management or efficiency ratios, and market value ratios. Because many small businesses are not publicly held and have no publicly traded stock, market ratios play no role in analyzing a small firm’s performance. This section will review some of the most commonly used ratios in each category.
Liquidity ratios provide insight into a firm’s ability to meet its short-term debt obligations. It draws information from a business’s current assets and current liabilities that are found on the balance sheet. The most commonly used liquidity ratio is the current ratio given by the formula
current assets / current liabilities
The normal rule of thumb is that the current ratio should be greater than one if a firm is to remain solvent. The greater this ratio is above one, the greater its ability to meet short-term obligations. As with all ratios, any value needs to be placed in context. This is often done by looking at standard ratio values for the same industry. These ratios are provided by Dun and Bradstreet; these data are also available on websites, such as Bizstats.com.
Another ratio used to evaluate a business’s ability to meet its short-term debt obligations is the quick ratio—also known as the acid test. It is a more stringent version of the current ratio that recognizes that inventory is the least liquid of all current assets. A firm might find it impossible to immediately transfer the dollar value of inventory into cash to meet short-term obligations. Thus the quick ratio, in effect, values the inventory dollar value at zero. The quick ratio is given by the following formula:
current assets − inventory / current liabilities
Using the data provided in the balance sheet for Acme Enterprises, we can compute the current ratio and the quick ratio.
Liquidity Ratio Results
| 2005 (%) | 2006 (%) | 2007 (%) | 2008 (%) | 2009(%) | 2010 (%) | |
|---|---|---|---|---|---|---|
| Acme’s current ratio | 0.83 | 0.79 | 0.75 | 0.70 | 0.65 | 0.60 |
| Industry’s current ratio | 1.15 | 1.08 | 1.04 | 1.02 | 1.03 | 1.01 |
| Acme’s quick ratio | 0.63 | 0.60 | 0.57 | 0.53 | 0.49 | 0.45 |
| Industry’s quick ratio | 1.04 | 1.02 | 0.98 | 0.95 | 0.94 | 0.91 |
One should immediately notice that this business appears to be in serious trouble. None of the current ratios are above of value of 1.0, which indicates that the business would be unable to meet short-term obligations to its creditors should they have to be paid. Acme’s current ratios are below the industry’s average values; however, it should be noted that the industry’s values are quite close to one. Further, the current ratio values for Acme and the industry are declining, but Acme’s are declining quite significantly. This indicates the financially precarious position of the firm is growing steadily worse. The quick ratio shows an even direr situation should the firm not be able to sell off its inventory at market value. Acme’s quick ratio values are well below the industry’s average. Without these two ratios, a quick perusal of the total current assets of Acme Enterprises would result in a false impression that the firm is growing in a healthy fashion and current assets are rising.
Financial leverage ratios provide information on a firm’s ability to meet its total and long-term debt obligations. It draws on information from both the balance sheet and the income statement. The first of these ratios—the debt ratio—illustrates the extent to which a business’s assets are financed with debt. The formula for the debt ratio is as follows:
total debt / total assets
A variation on the debt ratio is the ratio of debt to the total owner’s equity (the debt-to-equity ratio). As with the other ratios, one cannot target a specific, desirable value for the debt-to-equity ratio. Median values will vary significantly across different industries. The automobile industry, which is rather capital intensive, has debt-to-equity ratios above two. Other industries, such as personal computers, may have debt-to-equity ratios under 0.5.[19] The formula for the debt-to-equity ratio is as follows:
total debt / total owner’s equity
One can refine this ratio by examining only the long-term portion of total debt to the owner’s equity. Comparing these two debt-to-equity ratios gives insight into the extent to which a firm is using long-term debt versus short-term debt. The formula for the long-term debt-to-owner’s equity ratio is as follows:
long-term debt / total owner’s equity
The interest coverage ratio examines the ability of a firm to cover or meet the interest payments that are due in a designated period. The formula for the interest coverage ratio is as follows:
EBIT / total interest charges
The financial leverage ratios for Acme and its industry are provided below. Interestingly, Acme’s debt-to-total-assets ratio has declined over the last six years. Further, its ratio has always been lower than the industry average in every year. This stands in contrast to the liquidity ratios. The business’s debt-to-equity ratio has declined precipitously over the last six years and was significantly lower than the industry averages. The same is true for the long-term debt-to-equity ratios. These ratios have declined for several reasons. The total assets of the firm have doubled over the last six years, and equity has grown by a factor of five while the long-term debt has remained constant. It would appear that the firm has been financing its growth with short-term debt and its own profits. However, one should note that the times interest earned ratio has declined dramatically, falling to approximately half the level of the industry average in 2010. This indicates that the firm has less ability to meet its debt obligations. In conjunction with the results of the other ratios, one would say that Acme has relied, excessively, on its short-term debt and should take actions to return to a firmer financial footing.
Financial Leverage Ratios Results
| 2005 (%) | 2006 (%) | 2007 (%) | 2008 (%) | 2009 (%) | 2010 (%) | |
|---|---|---|---|---|---|---|
| Acme’s debt-to-total assets ratio | 0.86 | 0.78 | 0.73 | 0.69 | 0.67 | 0.65 |
| Industry’s debt-to-total assets ratio | 1.01 | 0.97 | 0.95 | 0.92 | 0.89 | 0.86 |
| Acme’s debt-to-equity ratio | 6.14 | 3.57 | 2.68 | 2.22 | 1.99 | 1.86 |
| Industry’s debt-to-equity ratio | 3.31 | 3.25 | 3.67 | 3.11 | 2.96 | 2.65 |
| Acme’s long-term debt-to-equity ratio | 1.88 | 1.02 | 0.70 | 0.53 | 0.43 | 0.36 |
| Industry’s long-term debt-to-equity ratio | 1.52 | 1.54 | 1.42 | 1.32 | 1.27 | 1.12 |
| Acme’s times interest earned ratio | 14.76 | 12.34 | 10.68 | 8.52 | 7.17 | 5.52 |
| Industry’s times interest earned ratio | 11.55 | 11.61 | 10.95 | 10.65 | 10.43 | 10.01 |
The next grouping of ratios is the profitability ratios. Essentially, these ratios look at the amount of profit that is being generated by each dollar of sales (revenue). Remember, from the review of the income statement, we can identify three different measures of profit: gross profit, operating profit, and net profit. Each measure of profit can be examined with respect to the net sales of a business, and each can give us a different insight into the overall efficiency of a firm in generating profit.
The first profitability ratio examines how much gross profit is generated by each dollar of revenue and is given by the following formula:
gross profit margin = gross profit / revenue
The next examines operating profit per dollar of sales and is calculated in the following manner:
operating profit margin = operating profit / revenue
Lastly, the net profit margin is the one that is mostly used to evaluate the overall profitability of a business. It is determined as follows:
net profit margin = net profit / revenue
The profitability ratios for Acme and its industry are provided below. Acme has seen a slight increase in its gross profit margin over the last six years, which indicates a reduction in either direct labor or direct materials costs. Acme’s gross profit margin is slightly lower, across the six years, than the industry’s mean values. Acme’s operating profit margins have declined, particularly since 2008. This would indicate, in light of an increasing gross profit margin, that its operating expenses have increased proportionately. Acme’s operating profit margins had parity with its industry until 2008. The most troublesome results may be the net profit margins, which experienced a one-third decline over the last six years. Although the industry’s net profit margins have declined, they have not done so at the same rate as those for Acme. These results indicate that Acme needs to carefully review its operational expenses with a clear intention to reduce them.
Profitability Ratios Results
| 2005 (%) | 2006 (%) | 2007 (%) | 2008 (%) | 2009 (%) | 2010 (%) | |
|---|---|---|---|---|---|---|
| Acme’s gross profit margin | 50.0 | 50.0 | 51.0 | 51.0 | 52.0 | 52.0 |
| Industry’s gross profit margin | 51.2 | 51.3 | 51.6 | 51.5 | 53.2 | 53.1 |
| Acme’s operating profit margin | 15.5 | 14.3 | 14.0 | 12.7 | 12.3 | 10.9 |
| Industry’s operating profit margin | 14.7 | 14.1 | 14.2 | 13.2 | 13.0 | 13.2 |
| Acme’s net profit margin | 9.5 | 8.7 | 8.4 | 7.4 | 7.0 | 6.0 |
| Industry’s net profit margin | 9.2 | 8.9 | 8.5 | 8.4 | 8.1 | 7.9 |
The last category of financial ratios is the asset management or efficiency ratios. These ratios are designed to show how well a business is using its assets. These ratios are extremely important for management to determine its own efficiency. There are many different activity or efficiency ratios. Here we will examine just a few. The sales-to-inventory ratio computes the number of dollars of sales generated by each dollar of inventory. Firms that are able to generate greater sales volume for a given level of inventory are perceived as being more efficient. This ratio is determined as follows:
sales to inventory = sales / inventory
There are other efficiency ratios that look at how well a business is managing its inventory. Some look at the number of days of inventory on hand; others look at the number of times inventory is turned over during the year. Both can be used to measure the overall efficiency of the inventory policy of a firm. For simplicity’s sake, these ratios will not be reviewed in this text.
The sales-to-fixed-asset ratio is another efficiency measure that looks at the number of dollars of sales generated by a business’s fixed assets. Again, one is looking for a larger value than the industry average because this would indicate that a business is more efficient in using its fixed assets. This ratio is determined as follows:
sales to fixed assets = sales / fixed assets
Another commonly used efficiency ratio is the days-in-receivables ratio. This ratio shows the average number of days it takes to collect accounts receivables. The desired trend for this ratio is a reduction, indicating that a firm is being paid more quickly by its customers. This ratio is determined as follows:
days in receivables = accounts receivable / (sales / 365). The 365 in the denominator represents the number of days in a year
Efficiency Ratios Results
| 2005 (%) | 2006 (%) | 2007 (%) | 2008 (%) | 2009 (%) | 2010 (%) | |
|---|---|---|---|---|---|---|
| Acme’s sales to inventory | 14.3 | 14.3 | 14.3 | 14.3 | 14.3 | 14.3 |
| Industry’s sales to inventory | 16.2 | 15.7 | 15.3 | 14.9 | 14.3 | 13.7 |
| Acme’s sales to fixed assets | 8.57 | 7.02 | 6.01 | 5.28 | 4.75 | 4.33 |
| Industry’s sales to fixed assets | 7.64 | 7.12 | 6.78 | 6.55 | 6.71 | 6.34 |
| Acme’s days in receivables | 36.5 | 36.5 | 36.5 | 36.5 | 36.5 | 36.5 |
| Industry’s days in receivables | 33.2 | 34.6 | 38.2 | 37.4 | 33.9 | 35.1 |
Almost immediately one should notice several interesting sets of value. Acme’s sales-to-inventory ratios for the period 2005 to 2010 and its days in receivables for the same time frame are constant. This is not true for the industry values. This might indicate that Acme has a rigorous policy of tying its inventory level to sales. Likewise, it would appear that Acme has some formal policy to explicitly link accounts receivable to sales volume. Industry values for both ratios fluctuated across the time span; however, it should be noted that the industry’s days in receivables fluctuated across a rather narrow band. Acme’s sales to fixed assets have been declining from 2005 to 2010. In fact, it has dropped almost in half. This is a sign that Acme’s ability to manage its assets vis-à-vis sales has declined significantly and should be a source of considerable worry for the management team.
Financial ratios serve an extremely useful purpose for small business owners who are attempting to identify trends in their own operations and see how well their business’s stand up against its competitors. As such, owners should periodically review their financial ratios to get a better understanding of the current position of their firms.
Key Takeaways
- Financial ratios enable external constituencies to evaluate the performance of a firm with respect to other firms in a particular industry.
- Ratio analysis can help a management team identify areas that might be of concern.
- The management team can track the performance on these ratios across time to determine whether the indicators are improving or declining.
- Financial ratios can be grouped into five categories: liquidity ratios, financial leverage ratios, asset management or efficiency ratios, profitability ratios, and market value ratios.
- Independent (London), April 21, 2010, quoted in “Accounting Quotes,” Qfinance, accessed February 14, 2012, www.qfinance.com/finance-and-business-quotes/accounting. ↵
- Ramnik Singh Wahla, Accounting Terminology Bulletin No. 1: Review and Résumé, 1953, accessed February 14, 2012, c0403731.cdn.cloudfiles.rackspacecloud.com/collection/papers/1950/1953_0101_AccountingReview.pdf. ↵
- Denise Schmandt-Besseart, “An Ancient Token System: The Precursor to Numerals and Writing,” Archaeology 39 (1986): 32–39; Richard Mattessich, “Prehistoric Accounting and the Problem of Representation: On Recent Archeological Evidence of Middle East from 8000 B.C. to 3000 B.C.,” Accounting Historians Journal 14, no. 2 (1987): 71–91. ↵
- Salvador Carmona and Mahmoud Ezzamel, “Accounting and Forms of Accountability in Major Civilizations: Mesopotamia and Ancient Egypt” (working paper, Instituto de Empresa Business School, Madrid, Spain, and Cardiff University, Cardiff, UK, 2005), accessed December 2, 2011, latienda.ie.edu/working_papers_economia/WP05-21.pdf. ↵
- John R. Alexander, History of Accounting (Princeville, HI: Association of Chartered Accountants in the United States, 2002), 4. ↵
- John R. Alexander, History of Accounting (Princeville, HI: Association of Chartered Accountants in the United States, 2002), 9. ↵
- Jean Murray, “Finding Help with Bookkeeping and Accounting Tasks,” About.com, accessed December 2, 2011, biztaxlaw.about.com/od/businessaccountingrecords/a/findacpa.htm. ↵
- “Edwin T. Freedley,” Cyber Nation, accessed February 14, 2012, www.cybernation.com/victory/quotations/authors/quotes_freedley_edwint.html. ↵
- “Comparison of Cash and Accrual Methods of Accounting,” Wikipedia, accessed December 2, 2011, en.wikipedia.org/wiki/comparison_of_cash_method _and_accrual method of accounting. ↵
- Melissa Bushman, “Cash Basis versus Accrual Accounting,” Yahoo! Voices, accessed December 2, 2011, voices.yahoo.com/cash-basis-versus-accrual-basis -accounting-147864.html?cat=3. ↵
- “Cash vs. Accrual Accounting,” Nolo.com, accessed December 2, 2011, www.nolo.com/legal-encyclopedia/cash-vs-accrual-accounting-29513.html. ↵
- “Accounting Quotes,” Qfinance, accessed February 14, 2012, www.qfinance.com/finance-and-business-quotes/accounting. ↵
- Walter Harrison, Charles Lungren, and Bill Thomas, Financial Accounting, 8th ed. (Boston, MA: Prentice Hall, 2010), 63. ↵
- “Work in Process,” BusinessDictionary.com, accessed December 2, 2011, www.businessdictionary.com/definition/work-in-process.html. ↵
- “Paid in Capital,” Investopedia, accessed December 2, 2011, www.investopedia.com/terms/p/paidincapital.asp. ↵
- “Retained Earnings,” The Free Dictionary, accessed December 2, 2011, financial-dictionary.thefreedictionary.com/Retained+Earnings. ↵
- Richard Bort, “Medium-Term Funds Flow Forecasting,” in Corporate Cash Management Handbook, ed. Richard Bort (New York: Warren Gorham & Lamont, 1990), 125. ↵
- “Accounting Quotes,” Qfinance, accessed February 14, 2012, www.qfinance.com/finance-and-business-quotes/accounting. ↵
- “Debt/Equity Ratio,” Investopedia, accessed December 2, 2011, www.investopedia.com/terms/D/debtequityratio.asp. ↵
The art of recording, classifying, and summarizing in a significant manner and in terms of money, transactions and events which are, in part at least, of a financial character, and interpreting the results thereof.
An accounting system that provides the appropriate information to the external community—bankers, angel investors, venture capitalists, and/or the government.
An accounting system that provides information to the management of a business and aids in internal controls—systems and policies that make a firm more efficient.
Sales are recorded when the money is received.
The focus is on measuring profits and matching revenues to expenses.
A report that examines the assets, liabilities, and owner’s equity of the business at some particular point in time.
Economic resources that are expected to produce a benefit in the future.
The amount of money owed to outside claims—people outside of a business.
The claims on a business by those who own the business.
Assets that will be held for less than one year.
The most liquid of all assets
Stocks and bonds that a business may hold in the hope that they will provide a greater return to the business rather than just letting cash “sit” in a bank account.
The amount of money due to a business from prior credit sales.
A formal debt instrument that will be paid to the company within a year.
An accrual accounting term that represents payments in advance of their actual occurrence.
Tangible goods, categorized as raw materials, WIP, and finished goods, held by a business for the production of goods and services.
Assets that will not be turned into cash within the next year.
Long-term assets generally valued at their original cost.
A noncash expense that specifically recognizes that assets decline in value over time.
Assets that provide economic value to a business but do not have a tangible, physical presence.
Debts and obligations that are to be paid within the year.
Money, such as lines of credit from banks, short-term bank loans, mortgage obligations, or payments on specific assets, that is owed and must be repaid within the year.
Short-term obligations that a business owes to suppliers, vendors, and other creditors.
The cumulative net income that has been reinvested in a business and not paid out to shareholders as dividends.
A report that provides an examination of the overall profitability of a firm over a particular period of time.
All the costs associated with the direct production of goods and services that were sold during the time period.
Income minus COGS.
Expenses that are incurred during the normal operation of a business.
Gross profit minus operating expenses.
Other nonoperational revenues and interest payments on loans and other debt instruments.
Operating profit minus other revenue and expenses.
EBT minus taxes.
A document that maps out where cash is flowing into a firm and where it flows out. It recognizes that there may be a significant difference between profits and cash flow.
A statement similar to the income statement in that it looks at cash inflows and cash outflows for a business during a specified period of time.
A statement that attempts to identify cash flows into a firm and cash flows from a firm for some future period. It recognizes that there may be a significant difference between profits and cash flow.
Ratios drawn from a business’s current assets and current liabilities on the balance sheet that provide insight on its ability to meet short-term debt obligations.
Ratios that provide information on a firm’s ability to meet its total and long-term debt obligations.
Ratios that are designed to show how well a business is using its assets.
Ratios that measure the performance of the stock of publicly held companies.
A highly effective measure to determine a business’s ability to meet it debt obligations. It is given by times interest earned = earnings before interest and taxes (EBIT) / interest charges.
